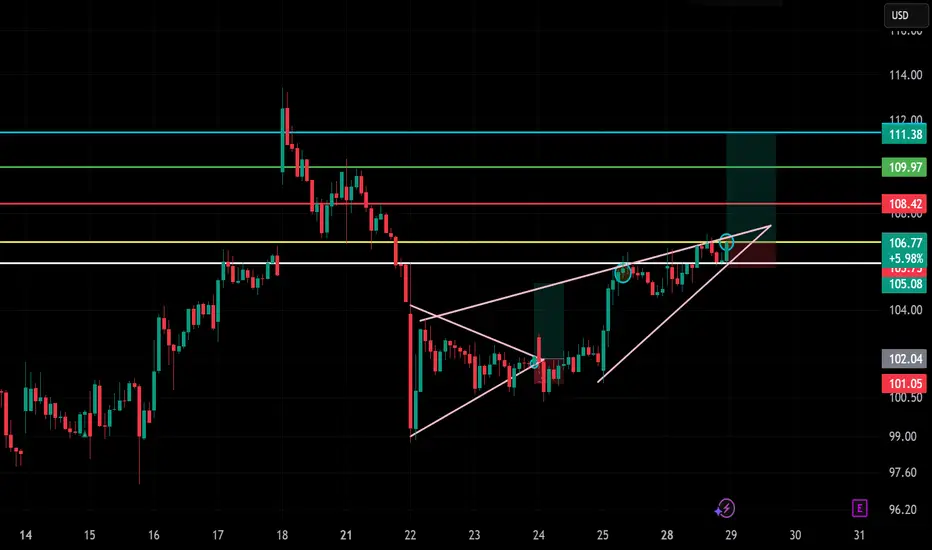
Trade Setup: LONG on HOOD!📈
🕰️ Timeframe: 30-minute chart
🔍 Pattern: Ascending wedge breakout
📉 Previous Trend: Bullish continuation from bottom
🧭 Setup: Breakout retest and continuation toward resistance zone
🧩 Technical Breakdown:
Breakout Zone:
Wedge breakout confirmed around $106.00–106.50
Current price near $106.77,
Next report date
—
Report period
—
EPS estimate
—
Revenue estimate
—
2.02 USD
1.41 B USD
2.98 B USD
739.47 M
About Robinhood Markets, Inc.
Sector
Industry
CEO
Vladimir Tenev
Website
Headquarters
Menlo Park
Founded
2013
FIGI
BBG008NMBXN8
Robinhood Markets, Inc is a financial services platform, which engages in the provision of retail brokerage and offers trading in U.S. listed stocks and Exchange Traded Funds, related options, and cryptocurrency trading, as well as cash management, which includes debit cards services. The company was founded by Vladimir Tenev and Baiju Prafulkumar Bhatt in 2013 and is headquartered in Menlo Park, CA.
Related stocks
Hood 5th wave looks toppyHood is one of my larger holdings and I have been riding the wave waiting for a pullback for months. I believe the time is now. This is chart I posted elsewhere that I forgot to share here. I think 65$ is a real possibility. The last four pullbacks were all over 40%. Not the stochastic monthly is st

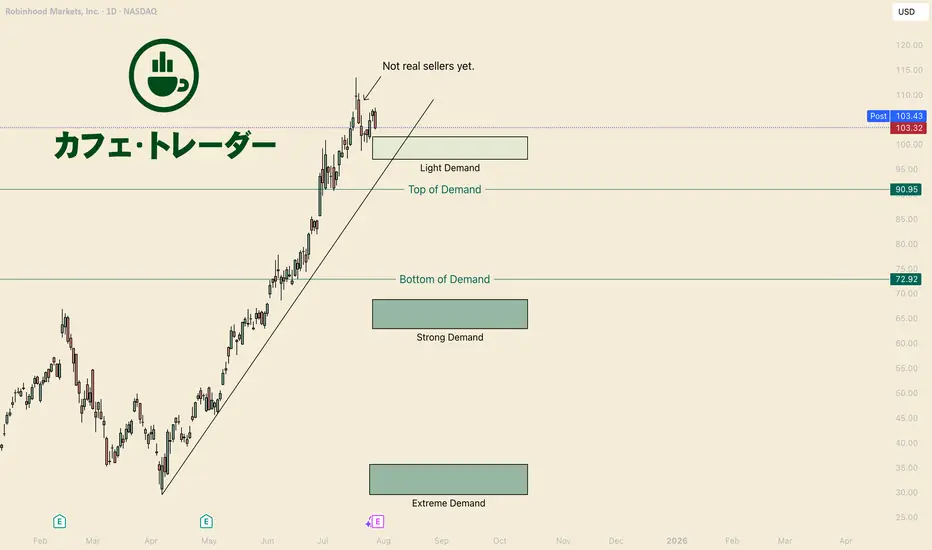
How to Buy HoodHello I am the Cafe Trader.
Since visiting that Extreme Demand back in April, Robinhood has essentially moved strait up.
If you have not seen my previous post on HOOD, we were able to identify EXACTLY where the buyers were. I strongly encourage you take a look at that article.
Today I'm going
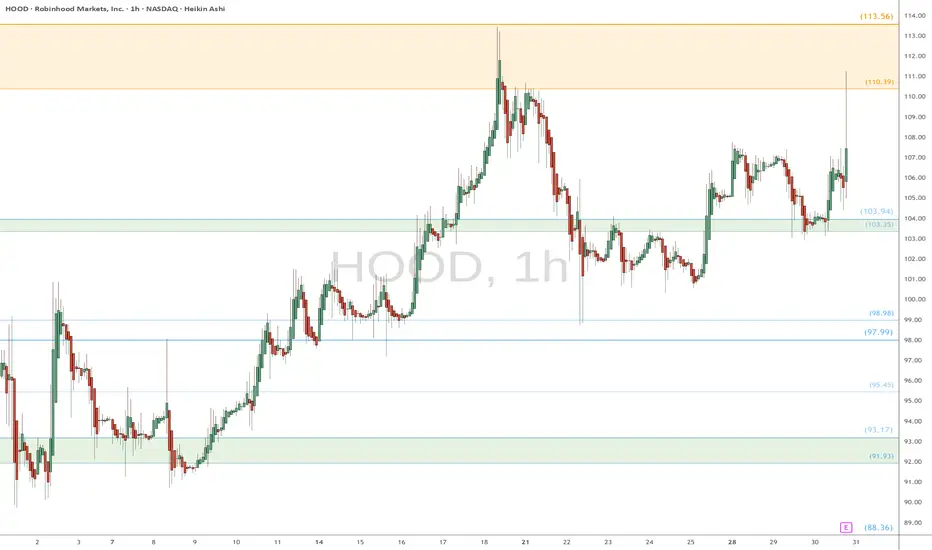
HOOD watch $110 then $113: Dual Golden fibs trying to TOP itHOOD has been a massive bull run since April lows.
Now battling a dual Golden fib zone $110.39-113.56.
Top of the zone is a well proven Golden Genesis fib.
See "Related Publications" for previous charts ------->>>>>>>
Such as this PERFECT catch of a serious bounce:
Hit BOOST and FOLLOW for more s
Everyone's Bullish On Robinhood - But Its Time To SellRobinhood NASDAQ:HOOD has seen an incredible rally over the past year, rising more than 500% since August 2023. Much of this surge has been driven by renewed crypto enthusiasm—sparked by Circle’s IPO—and Robinhood’s aggressive push into new products across fintech and crypto.
But despite strong

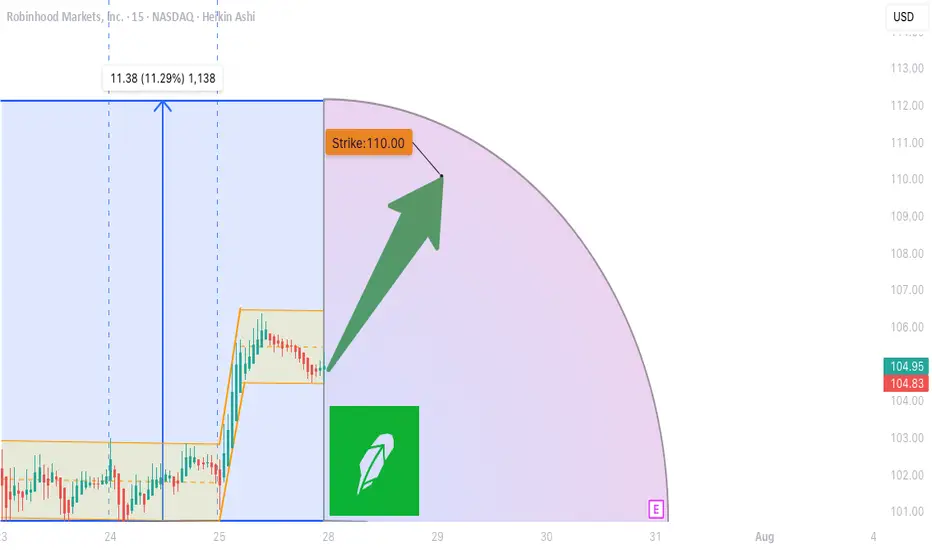
HOOD WEEKLY TRADE IDEA (07/27/2025)
**🚨 HOOD WEEKLY TRADE IDEA (07/27/2025) 🚨**
**BULLISH OPTIONS FLOW MEETS EVENT RISK CAUTION**
📊 **Options Flow Snapshot:**
📈 **Call Volume > Put Volume**
🧮 **Call/Put Ratio: 2.30** → **Institutional Bullish Flow**
📈 **Momentum Readings:**
* 🟢 **Daily RSI: Bullish**
* 🟡 **Weekly RSI: Mixed to Wea
HOOD TIME FOR BOUNCE?HOOD on a 4 day pullback. Some big call flow just came in 105C 8/1/25 @ 4.40 $3.5 million in 4 orders.
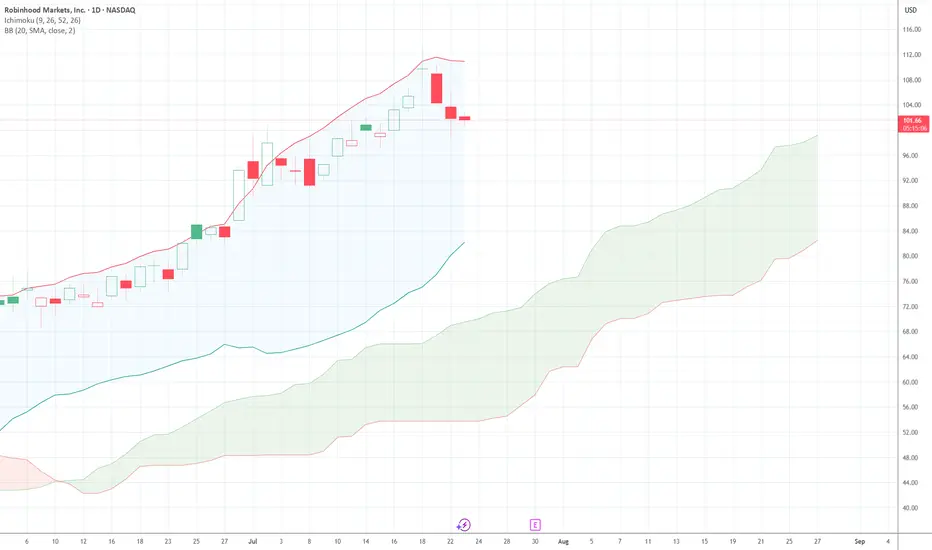
Using the Fractal Alligator IndicatorAccording to the Fractal Alligator in TradingView, we have come to a top/peak of HOOD stock price.
Using a 4 hour chart we can clearly see that green triangle, marking our top.
However when viewing the daily chart, there is no "top" green triangle.
This indicator is great, if you try it on diff

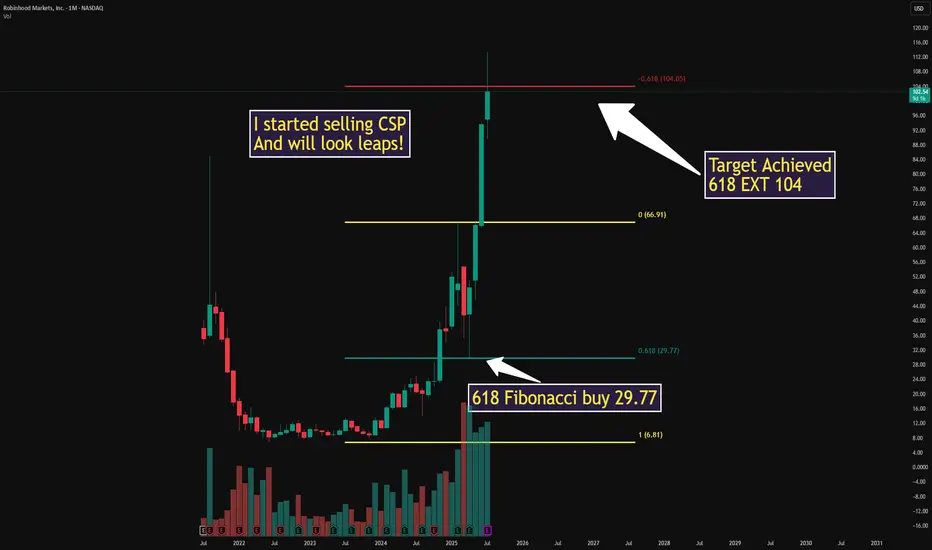
$HOOD ONCE IN A LIFETIMEAs discussed we hit the measured move Fibonacci target from 29.77 to 104
This pullback is EXPECTED TO TRAP CHASERS
I entered into cash secured puts then will add LEAPS as we pull back
ALL WILL BE ALERTED HERE NO CHARGE just LIKE this post!
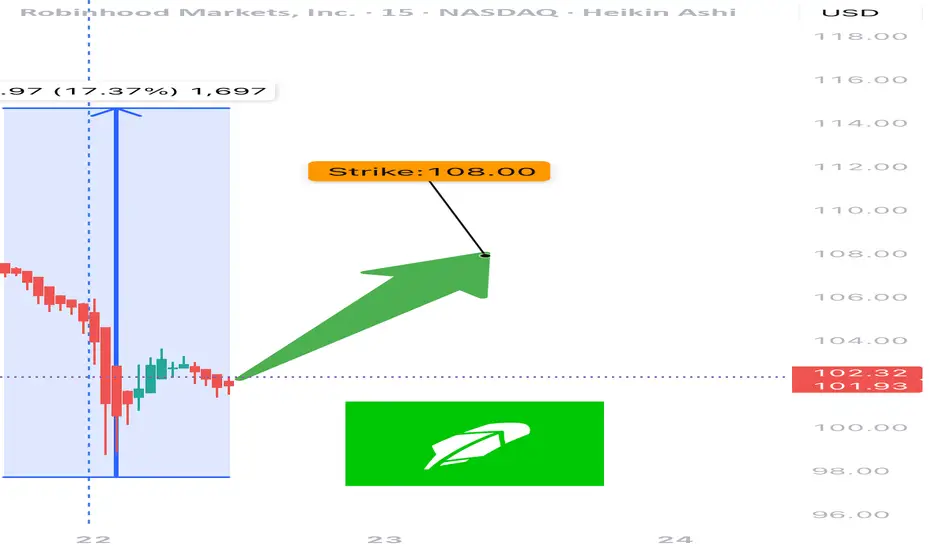
HOOD Weekly Options Setup – July 22, 2025
🔥 NASDAQ:HOOD Weekly Options Setup – July 22, 2025
Moderate Bullish Flow | RSI Divergence | 3DTE Tactical Setup
⸻
🧠 Summary Thesis:
While the call/put ratio (1.42) and favorable VIX (16.9) suggest bullish sentiment, fading RSI and neutral volume raise tactical caution. This setup is not for p
See all ideas
Summarizing what the indicators are suggesting.
Neutral
SellBuy
Strong sellStrong buy
Strong sellSellNeutralBuyStrong buy
Neutral
SellBuy
Strong sellStrong buy
Strong sellSellNeutralBuyStrong buy
Neutral
SellBuy
Strong sellStrong buy
Strong sellSellNeutralBuyStrong buy
An aggregate view of professional's ratings.
Neutral
SellBuy
Strong sellStrong buy
Strong sellSellNeutralBuyStrong buy
Neutral
SellBuy
Strong sellStrong buy
Strong sellSellNeutralBuyStrong buy
Neutral
SellBuy
Strong sellStrong buy
Strong sellSellNeutralBuyStrong buy
Displays a symbol's price movements over previous years to identify recurring trends.
Curated watchlists where HOOD is featured.


Frequently Asked Questions
The current price of HOOD is 99.90 USD — it has decreased by −3.06% in the past 24 hours. Watch Robinhood Markets, Inc. stock price performance more closely on the chart.
Depending on the exchange, the stock ticker may vary. For instance, on NASDAQ exchange Robinhood Markets, Inc. stocks are traded under the ticker HOOD.
HOOD stock has fallen by −1.62% compared to the previous week, the month change is a 9.48% rise, over the last year Robinhood Markets, Inc. has showed a 378.22% increase.
We've gathered analysts' opinions on Robinhood Markets, Inc. future price: according to them, HOOD price has a max estimate of 130.00 USD and a min estimate of 50.00 USD. Watch HOOD chart and read a more detailed Robinhood Markets, Inc. stock forecast: see what analysts think of Robinhood Markets, Inc. and suggest that you do with its stocks.
HOOD reached its all-time high on Jul 18, 2025 with the price of 113.44 USD, and its all-time low was 6.81 USD and was reached on Jun 16, 2022. View more price dynamics on HOOD chart.
See other stocks reaching their highest and lowest prices.
See other stocks reaching their highest and lowest prices.
HOOD stock is 12.03% volatile and has beta coefficient of 3.13. Track Robinhood Markets, Inc. stock price on the chart and check out the list of the most volatile stocks — is Robinhood Markets, Inc. there?
Today Robinhood Markets, Inc. has the market capitalization of 88.25 B, it has increased by 4.61% over the last week.
Yes, you can track Robinhood Markets, Inc. financials in yearly and quarterly reports right on TradingView.
Robinhood Markets, Inc. is going to release the next earnings report on Oct 29, 2025. Keep track of upcoming events with our Earnings Calendar.
HOOD earnings for the last quarter are 0.42 USD per share, whereas the estimation was 0.31 USD resulting in a 36.94% surprise. The estimated earnings for the next quarter are 0.40 USD per share. See more details about Robinhood Markets, Inc. earnings.
Robinhood Markets, Inc. revenue for the last quarter amounts to 989.00 M USD, despite the estimated figure of 914.55 M USD. In the next quarter, revenue is expected to reach 1.05 B USD.
HOOD net income for the last quarter is 386.00 M USD, while the quarter before that showed 336.00 M USD of net income which accounts for 14.88% change. Track more Robinhood Markets, Inc. financial stats to get the full picture.
No, HOOD doesn't pay any dividends to its shareholders. But don't worry, we've prepared a list of high-dividend stocks for you.
As of Aug 4, 2025, the company has 2.3 K employees. See our rating of the largest employees — is Robinhood Markets, Inc. on this list?
EBITDA measures a company's operating performance, its growth signifies an improvement in the efficiency of a company. Robinhood Markets, Inc. EBITDA is 1.62 B USD, and current EBITDA margin is 38.82%. See more stats in Robinhood Markets, Inc. financial statements.
Like other stocks, HOOD shares are traded on stock exchanges, e.g. Nasdaq, Nyse, Euronext, and the easiest way to buy them is through an online stock broker. To do this, you need to open an account and follow a broker's procedures, then start trading. You can trade Robinhood Markets, Inc. stock right from TradingView charts — choose your broker and connect to your account.
Investing in stocks requires a comprehensive research: you should carefully study all the available data, e.g. company's financials, related news, and its technical analysis. So Robinhood Markets, Inc. technincal analysis shows the neutral today, and its 1 week rating is buy. Since market conditions are prone to changes, it's worth looking a bit further into the future — according to the 1 month rating Robinhood Markets, Inc. stock shows the buy signal. See more of Robinhood Markets, Inc. technicals for a more comprehensive analysis.
If you're still not sure, try looking for inspiration in our curated watchlists.
If you're still not sure, try looking for inspiration in our curated watchlists.