Hood channel attemptAfter further analysis it looks like HOOD is going to attempt to break out of this channel. A bounce at the median range of this channel with a continue upward pointing stochastic RSI is bullish. OBV is still within a long term channel as well. This is one of the weaker charts out there, as investors search for value in an overheated market, plays like sofi, hood, and hims present opportunity.
There is no price action outside of the channel until 35$, not to say the stock or company is worth that, but TA wise this chart looks like how altcoins dumped, no support just straight down.
HOOD trade ideas

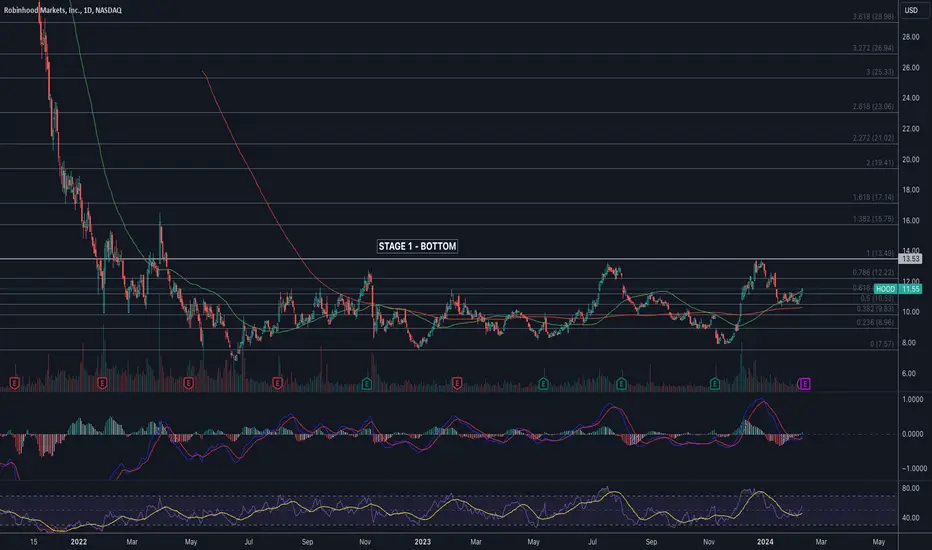
$HOOD - What do you think?NASDAQ:HOOD Still in Stage 1, undergoing the bottoming process. It needs a weekly close above $13.50 to confirm a breakout from Stage 1.
Currently, it is trading between the 50-day and 200-day moving averages (DMA).
The earnings report (ER) is scheduled for February 13th.
My expectations:
$13.50 - if the ER is good
$9.80 - if the ER is bad"
Closed HOOD tradeA review of a previous gap trade on Hood, this one played out VERY well after that small bear flag. I try to mark my entries with dotted greens upon first posting trades to be transparent. I am looking to possibly enter hood again before earnings but I need to do some more charting first.
Here you could see marked a 5% downside and 17+ % upside, this is the risk to reward you want to see when using shorter dated options.

Is Robinhood About To Take Off? 👀Hey everyone!
It's been a busy start to the new year, as a number of popular stocks have been making new highs. In case you've been hiding under a rock, you can see examples of this action in NASDAQ:NVDA and NYSE:ANET - or any of the large banks in the Financial sector like NYSE:JPM
But, if you're like us, then it's likely that you want to get into the next move before it happens, not after it's already made the rest of the market rich.
That's why we're looking at Robinhood. Getting into the stock right now might be the way to go, because the company is set to announce a number of new products which promise to re-invigorate customer and investor interest in the company. Here's what's coming down the pike:
International Expansion - UK Equity Offering 📈
Robinhood is set to launch its equity offering in the UK, marking its first international expansion. This move is significant as international retail brokerage faces less pressure compared to the U.S., offering a potentially less competitive market. With a modular approach to expanding globally, Robinhood aims to leverage its platform for faster launches in multiple jurisdictions, potentially making international business a substantial part of its total revenue.
Crypto Offering in the EU 📈
In addition to the UK launch, Robinhood is extending its Crypto offering to the EU. This move not only taps into the growing interest in cryptocurrency but also allows the company to refine its international strategy with relatively low risk to its core U.S. business. With the global interest in digital assets, this expansion could contribute to Robinhood's revenue diversification.
Credit Card Offering within Robinhood Gold 📈
Robinhood is gearing up to launch a Credit Card offering built into its subscription membership program, Robinhood Gold. The integration of the credit card into the membership strengthens the moat around the program. The CEO's optimism and the anticipated scale of Robinhood's customer base suggest that this new product could contribute to the momentum of Robinhood Gold, offering potential growth opportunities.
Futures Launch in 2024 📈
Looking ahead, Robinhood plans to launch futures trading in 2024. The CEO sees this as a potential nine-figure revenue business. A well-designed futures product, especially on mobile, could open up new revenue streams for Robinhood. The move into futures trading not only provides a new source of income but also positions Robinhood as a more sophisticated platform, potentially changing perceptions among professional traders - something that could bring more revenue in tangentially.
It's true that the company is only breakeven for the time being, but things have improved significantly since IPO, when Dogecoin trading made up nearly 6% of total revenue:
As the company begins to launch new products, we think it could follow in the footsteps of COIN, which has also seen a big run out of the doldrums.
Keep your eyes on this one; we think it looks like a great buy if it manages to breakout of its current range.
Cheers!
Looking for more high-quality trade ideas? Follow us below. ⬇️⬇️


Biggest trade of the yearI officially hit my biggest trade of the year in the last two weeks of December. I had a huge amount of conviction on this trade and it happened fast. 60% in less than a month. 2024 will be special.

A stock in the makingSince May of 2022 this stock has been trading horizontal seemingly forming a base for the next bull run of the market. Robinhood will likely not be going anywhere for awhile, so I do like this as the bottom after its IPO. The red resistance line is pure speculation at this point as we will need further data to confirm this. The resistance lines are shallowing in angle and are ready to turn in the upward direction though. It could possibly touch the green support line one more time before turning up for the long haul though, depending on what our market does in the short term. overall I do feel as if this stock is in buy territory at the moment for a long term position. After another bounce up I will move my red resistance line accordingly. Then I feel as if the next dip will set the support line to an upward angle as well. After that we shall be off to the races so to speak. I am not a financial advisor though so trade with your own decisions. This is also not a paid advertisement for the company. I just like the chart.


HOOD: Price is Close To a Key Support Area $6.8 - $7.6HOOD: Price is Close To a Key Support Area $6.8 - $7.6
I have shared the HOOD analysis two times over the past months and in both analysis
the price reacted very well.
The bullish movement started from the same area where we are currently focused between $6.8 - $7.6
Price can react taking past reactions into account.
It seems that the market players are well positioned there
considering how the price reacts near the support zone.
Thanks and good luck!
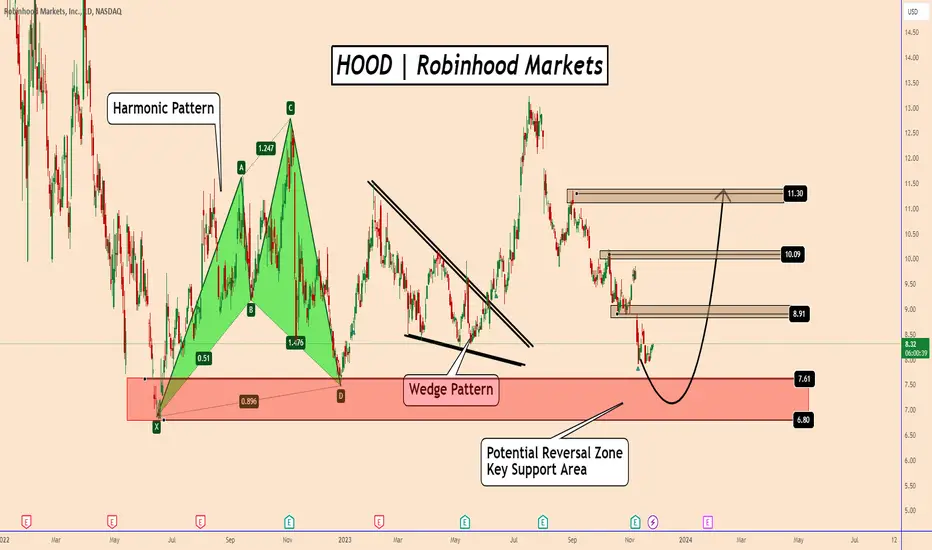
Robin Hood- Ready for the pump?Robin Hood- Ready for the pump?
As you can see, there is a falling wedge in a acumulation area , we need a broken trend line with a broken reistance confirmation.

Robinhood (NASDAQ: HOOD) Announces UK Launch
Robinhod (NASDAQ: HOOD) Chief Executive Officer Vlad Tenev recently said that he does not think that the payment for order flow (PFOF) model of market-maker routing that the firm incorporates in the United States is under any type of threat.
This would be despite suggestions from various consumer trading advocates as well as regulators for a complete ban on the PFOF model.
In statements shared with CNBC, Tenev reportedly defended the PFOF model, noting that it is inherently “here to stay.” He was making a reference to PFOF as it currently exists in the US, where the practice has been made legal and is well-regulated.
PFOF is essentially the practice of routing trades via market-makers such as Citadel Securities in exchange for a portion of the profits.
The business model has helped trading companies such as Robinhood with lowering commissions all the way down to zero, making it more economical for consumers to invest in a large range of stocks.
PFOF has been considered controversial due to the apparent conflict of interest it can potentially create between the broker and customers.
Industry professionals claim that brokers have an incentive or motivation to direct order flow to market makers providing PFOF arrangements over the best interests of customers.
At present, PFOF is banned in the United Kingdom, where Robinhood revealed its plans to launch operations (this past Thursday).
Notably, the US Securities and Exchange Commission (SEC) had looked into the possibility of placing a ban on PFOF due to concerns regarding the practice, however, the regulator decided not to do so, meanwhile, the EU has placed a complete ban on PFOF.
PFOF reportedly makes up for a relatively small amount of Robinhood’s total revenues, Tenev calims, and most of its earnings come from net interest income which is obtained from cash in user account balances.

Robinhood Wyckoff Accumulation (Fakeout Chart)This is an alternative Robinhood Wyckoff Accumulation path inspired by the SNAP Wyckoff Accumulation chart that I will post later. Enjoy!

$HOOD Wyckoff AccumulationRobinhood seems to be following Wyckoff Accumulation Schematic #2. Let's see if we find new lows before rocketing back up. Possible 80-100% move over the next year.

Possible Morning Star ReversalRobinhood looks like it's forming a morning star reversal. Monitor next weeks candle to confirm.

HOOD at a discount area of a rangeThis setup provides clear invalidation below discount area at 8.00$ with a take profit level at range premium of 12.00$, which gives 50% move. It can also be a tripple bottom with a neckline at 12.00$, which if flipped opens a target of 18.00$. I’m entering it here and leaving room to DCA lower.

HOOD |Robinhood| Purchase zone from $ 4.75 and belowEntering a long position.
Buying off a tool from $ 4.75 and below.
After consolidation at the level of $ 4.75, the instrument can give an excellent profit

Hood updateI did layer on more calls on the ARK news adding more hood shares. Alphabet did sell their remaining shares which might have caused that large red candle. The HV has plummeted to very low levels along with RSI which makes me believe this is oversold. First sell target is 9.45$, we are approaching the daily gap and I believe this can close very quickly with this bullish CPI print.

Hood GAP playI entered this hood call setup during the blood yesterday, the dotted green line is my entry. Frist profit take zone is the dashed green and the bag will be sold at 9.58ish. This selloff seems irrational to me, the market is so emotional these days.

Hood dump on earnings, potential gapI did enter this trade with call setups, this daily gap is a decent size and the bollanger bands are compressing nicely. The RSI has a general uptrend, the dashed green lines are important areas of historical price action. The upside is about 3x the downside on this setup.

Robinhood Markets - TIME TO BUYThis chart its a weekly one.
Just starting to acumulate on spot , first buy at 8.4, the next ones will be at the supports lines.

Good Buy Stocks > $HOODAfter losing nearly 90% of it's high, NASDAQ:HOOD is currently trading close to all-time lows. This could make for a great buy and hold opportunity, whilst some patience may be needed to wait for ideal target zones.
Higher lows are observed after bottoming out at $6, indicating that the bottom is most likely in for NASDAQ:HOOD . In other words a spot entry here has a really low risk and high reward setup.

Good-Buy STOCKS: HOODHi Traders, Investors and Speculators of Charts📈📉
After losing nearly 90% of it's high, NASDAQ:HOOD is currently trading close to all-time lows. This could make for a great buy and hold opportunity, whilst some patience may be needed to wait for ideal target zones.
Higher lows are observed after bottoming out at $6, indicating that the bottom is most likely in for HOOD. In other words a spot entry here has a really low risk and high reward setup.
_______________________
📢Follow us here on TradingView for daily updates and trade ideas on crypto , stocks and commodities 💎Hit like & Follow 👍
We thank you for your support !
CryptoCheck
NASDAQ:HOOD

Double Buy Signal For HOODRobinhood has a double buy signal by market scripters very accurate buy and sell indicator. So accurate that they charge a monthly subscription to have access to this script. MACD also shows growing bullish divergence and the elliot wave shows that wave 2 is in process and can continue Monday. Looking to trade the wave with options calls and make a quick profit.
