Bitcoin To New Highs?NASDAQ:IBIT and COINBASE:BTCUSD have completed double bottoms. The first price target for IBIT is 56.9 with 63.37 also being a new all time high possibility
IBIT trade ideas

BlackRock's Bitcoin ETF Can Be Unfolding A Bullish ImpulseBlackRock's Bitcoin ETF with ticker IBIT made a massive rally in 2024, which can be wave 3 of an ongoing five-wave bullish impulse. Despite the recent decline at the beginning of 2025, it's still above 42 invalidation level, and as long as it's above that level, it can be wave 4 correction, so we may still see that 5th wave this year.
The Elliott Wave Principle is a form of technical analysis that identifies patterns in market movements. A bullish impulsive wave is one of the most important and common wave structures in an uptrend. It describes how prices typically move in the direction of the main trend. A bullish impulsive wave consists of five waves labeled 1, 2, 3, 4, 5.

IBIT | Key Support & Resistance Zones to WatchIBIT, the new Bitcoin ETF, is carving out a clear structure right now. If you’ve been following my updates, you know I only share setups backed by solid signals—and this one fits the bill.
🟢 Support Zone
The green box marks the first area where buyers have shown up and defended price. If IBIT pulls back into this zone and holds, it’s where I’ll look for signs of renewed demand—think clean higher‑lows on a 5‑ or 15‑minute chart, accompanied by positive CDV shifts and rising volume.
🔴 First Strong Resistance
Above the current price, the red box stands as the first major hurdle. Historically, these levels have prompted sellers to step in aggressively. A rally into this zone demands caution—watch for lower‑time‑frame breakdowns and volume confirmation before considering any short entries.
🎯 Trading Plan
Long from Support
Wait for a drop into the green box. If price forms a strong base there with LTF breakout confirmation, that’s my cue to enter long.
Short at Resistance
If IBIT reaches the red box and shows clear exhaustion—lower‑time‑frame structure breaks and CDV weaknesses—then I’ll look for a short opportunity.
Adapt with the Market
I will not insist on any bias. If price breaks above the red box with conviction and retests it as support, I will switch to a bullish view. If the green box breaks without retest, I’ll reassess and stay patient.
💡 Why This Matters
You’re not just following random boxes—you’re trading with a proven framework that has delivered one of the highest success rates you’ll find. Every level I share comes from careful analysis and live‑market testing. Stick with this approach, and you’ll trade with confidence rather than guesswork.
📌I keep my charts clean and simple because I believe clarity leads to better decisions.
📌My approach is built on years of experience and a solid track record. I don’t claim to know it all but I’m confident in my ability to spot high-probability setups.
📌If you would like to learn how to use the heatmap, cumulative volume delta and volume footprint techniques that I use below to determine very accurate demand regions, you can send me a private message. I help anyone who wants it completely free of charge.
🔑I have a long list of my proven technique below:
🎯 ZENUSDT.P: Patience & Profitability | %230 Reaction from the Sniper Entry
🐶 DOGEUSDT.P: Next Move
🎨 RENDERUSDT.P: Opportunity of the Month
💎 ETHUSDT.P: Where to Retrace
🟢 BNBUSDT.P: Potential Surge
📊 BTC Dominance: Reaction Zone
🌊 WAVESUSDT.P: Demand Zone Potential
🟣 UNIUSDT.P: Long-Term Trade
🔵 XRPUSDT.P: Entry Zones
🔗 LINKUSDT.P: Follow The River
📈 BTCUSDT.P: Two Key Demand Zones
🟩 POLUSDT: Bullish Momentum
🌟 PENDLEUSDT.P: Where Opportunity Meets Precision
🔥 BTCUSDT.P: Liquidation of Highly Leveraged Longs
🌊 SOLUSDT.P: SOL's Dip - Your Opportunity
🐸 1000PEPEUSDT.P: Prime Bounce Zone Unlocked
🚀 ETHUSDT.P: Set to Explode - Don't Miss This Game Changer
🤖 IQUSDT: Smart Plan
⚡️ PONDUSDT: A Trade Not Taken Is Better Than a Losing One
💼 STMXUSDT: 2 Buying Areas
🐢 TURBOUSDT: Buy Zones and Buyer Presence
🌍 ICPUSDT.P: Massive Upside Potential | Check the Trade Update For Seeing Results
🟠 IDEXUSDT: Spot Buy Area | %26 Profit if You Trade with MSB
📌 USUALUSDT: Buyers Are Active + %70 Profit in Total
🌟 FORTHUSDT: Sniper Entry +%26 Reaction
🐳 QKCUSDT: Sniper Entry +%57 Reaction
📊 BTC.D: Retest of Key Area Highly Likely
📊 XNOUSDT %80 Reaction with a Simple Blue Box!
📊 BELUSDT Amazing %120 Reaction!
I stopped adding to the list because it's kinda tiring to add 5-10 charts in every move but you can check my profile and see that it goes on..

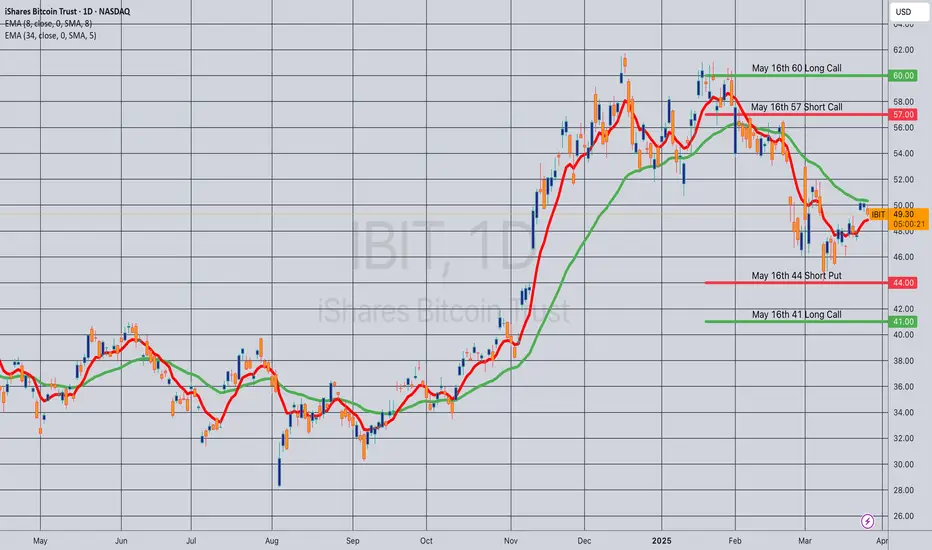
Opening (IRA): IBIT May 16th 41/44/57/60 Iron Condor... for a 1.02 credit.
Comments: Going neutral assumption here, selling the 25 delta's and buying wings 3 strikes out, collecting one-third the width of the wings.
Metrics:
Buying Power Effect: 1.98
Max Profit: 1.02
ROC at Max: 51.5%
50% Max: .51
ROC at 50% Max: 25.8%
Will generally look to take profit at 50% max, roll wings in on side test.
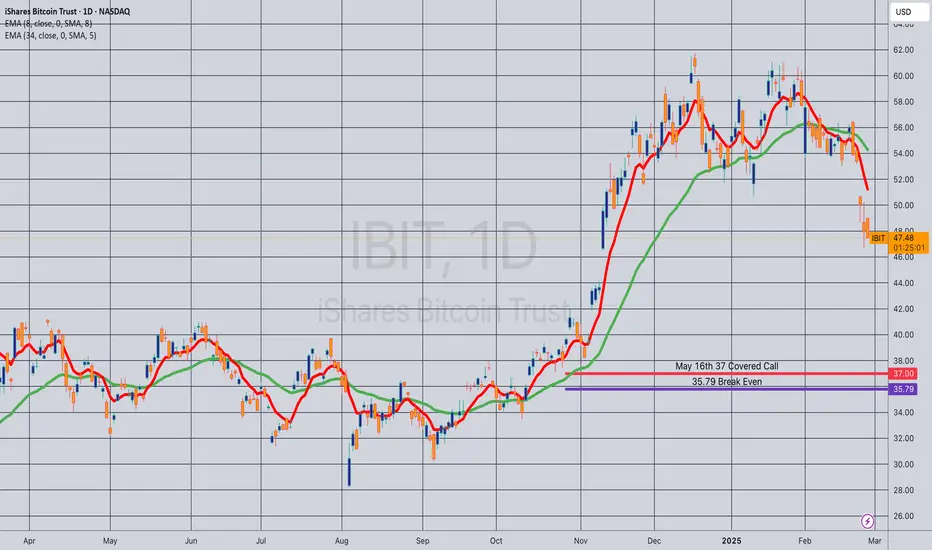
Opening (IRA): IBIT May 16th 37 Covered Call... for a 35.79 debit.
Comments: Laddering out a smidge here, selling the -84 delta call against shares to emulate the delta metrics of a 16 delta short put, but with the built-in defense of the short call.
Metrics:
Buying Power Effect/Break Even: 35.79
Max Profit: 1.21
ROC at Max: 3.38%
50% Max: .62
ROC at 50% Max: 1.69%
Will generally look to take profit at 50% max, add at intervals assuming I can get in at strikes/break evens better than what I currently have on, and/or roll out short call if my take profit is not hit.
Opening (IRA): IBIT March 28th 45 Covered Call... for a 43.91 debit.
Comments: Adding, but at lower delta and at strikes better than what I currently have on, selling the -84 delta call against shares to emulate the delta metrics of a 16 delta short put, but with the built-in defense of the short call.
Metrics:
Buying Power Effect/Break Even: 43.91
Max Profit: 1.09
ROC at Max: 2.48%
50% Max: .55
ROC at 50% Max: 1.24%

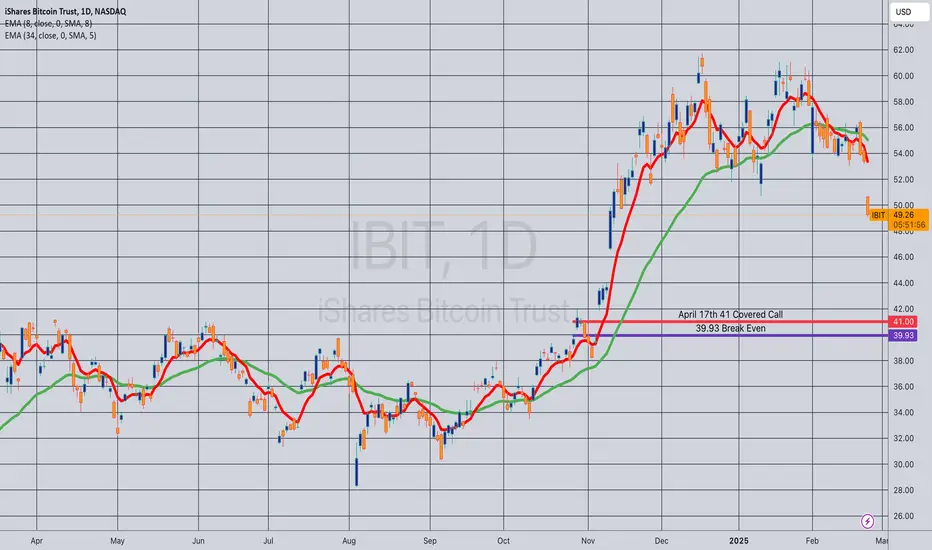
Opening (IRA): IBIT April 17th 41 Covered Call... for a 39.93 debit.
Comments: Adding to my position at strikes better than what I currently have on, selling the -84 delta call against shares to emulate the delta metrics of a 16 delta short put, but with the built-in defense of the short call.
Metrics:
Buying Power Effect/Break Even: 39.93/share
Max Profit: 1.07
ROC at Max: 2.68%
50% Max: .54
ROC at 50% Max: 1.34%
Will generally look to take profit, add at intervals assuming I can get in at strikes/break evens better than what I currently have on, and/or roll out short call if my take profit is not hit.
$IBIT Showing Long Term Strength Here at Gap Fill NASDAQ:IBIT Showing Long Term Strength Here at Gap Fill. With Bitcoin in extreme greed, ongoing tariffs and fears in the stock market, and a weekly timeframe retest we may see a reentry of accumulation here for smart money on a long term scale. Fundamentally BTC is looking better than ever.

IBIT IShares Bitcoin trust 24hr potterboxes.IBIT IShares Bitcoin Trust 24hr potterboxes. From the looks of things we are in a kinda free fall mode here. It has broken thru the floor $45.32 and is not that far off from the top of the bottom box $41.44. we shall see whats happens this is a very intresting day for the market. Happy Trading

IBIT Ishares Bitcoin trust 24hr potterboxesIBIT Ishares Bitcoin trust 24hr potterboxes. IBIT has bounced off of the floor of the box $45.30 and also the 200 day moving average. Its also above the 50 percent line or cost basis of the smaller box.$48.70 If it stays above this line it will likely continue up according to the parameters of the potterboxes. but since its below the 50 percent line of the bigger box $53.31 it will most likely stay uner the 50 percent line or cost basis of the bigger box. It needs to get above the 100 day moving average and start to climb. we never really know what is going to happen .but these boxes give you a since of where the support and resistence are more visible. so you can make a informed decision about buying or selling. So lets keep a eye on it. we will visit it later on down the road and see what happens. Happy trading.

IBIT Level for the Jump off Chart shows the Pivot level at $45 which is a big 30% drop from here .
Momentum is down, volume is down and the only way is to do a quick short.
If this pumps wait to hit $52 to see it it can be sustained .
I'll probably enter a long at the low levels and short now,

IBIT 24hr potterboxes.IBIT 24hr potterboxes. well it looks like IBIT has turned it around for now and is heading back up. Keep a eye on it . Happy trading.

$IBIT - Still expecting to go higherNASDAQ:IBIT broke down, and the pattern morphed into a broadening wedge. I still expect it to hit $65. Watch for a MACD crossover as an inflection point. The 50-day moving average (50DMA) will act as resistance.
For the bulls $51 needs to hold.

IBIT Ishares bitcoin trust 24hr potterbox bull flag?IBIT Ishares Bitcoin trust 24hr potterbox with bull flag. It looks like we have thrown a bull flag on the Bitcoin trust. $48.49 is the line in the sand for me. It looks like it wants to bounce. let pray that it bounces and pays off big. or it could go on down to $41.28. due to the empty space to the left i have marked it.well just keep a eye on it. Happy Trading

IBIT NASDAQ:IBIT
IBIT looks to be ready to get going into a new range in each chart. Setup multiple charts. Most popular Bitcoin ETF. Looks to be trending in favor of the most popular ETF with the proper amounts of exposure.
NASDAQ:IBIT NYSE:BLK

IBIT (BTC) target March 31stHere is my coinciding target for IBIT which I hold in my main investment account and 401k. I believe this will happen in March or April and my target for BTC is 143k with an IBIT price of 83.
We see a consolidation similar to the recent pump we have a few months ago. Deeply low stochastic RSI and a moderate BBWP. I think we see a 30-40% move soon.
My plan:
I am trading this setup by utilizing my recent COIN/CONL trade. I also plan to dump all my IBIT around these levels since I already own Bitcoin and have a mara trade on deck.

Opening (IRA): IBIT March 21st 49 Covered Call... for a 47.32 debit.
Comments: Adding to my positions at strikes/break evens better than what I currently have on, selling the -75 delta call against shares to emulate the delta metrics of a 25 delta short put, but with the built-in defense of the short call.
Metrics:
Buying Power Effect/Break Even: 47.32
Max Profit: 1.68
ROC at Max: 3.55%
50% Max: .84
ROC at 50% Max: 1.78%
Will generally look to take profit at 50% max, add at intervals, assuming I can get in at strikes/break evens better than what I currently have on, and/or roll out the short call should my take profit not be hit.

Opening (IRA): IBIT March 21st 52 Covered Call... for a 49.83 debit.
Comments: Back into IBIT, selling the -75 delta call against shares to emulate the delta metrics of a 25 delta short put, but with the built-in defense of the short call.
Metrics:
Buying Power Effect/Break Even: 49.83/share
Max Profit: 2.17
ROC at Max: 4.35%
50% Max: 1.09
ROC at 50% Max: 2.18%
Will generally look to take profit at 50% max, add at intervals, assuming I can get in at strikes better than what I currently have on, and/or roll out the short call if my take profit is not hit.

Opening (IRA): IBIT March 21st 48 Covered Call... for a 46.14 debit.
Comments: Adding to my current position at strikes better than what I have on, selling the -75 delta call against shares to emulate the delta metrics of a 25 delta short put, but with built-in short call defense.
Metrics:
Buying Power Effect/Break Even: 46.14
Max Profit: 1.86
ROC at Max: 4.03%
50% Max: .93
ROC at 50% Max: 2.02%
Will generally look to take profit at 50% max, add at intervals assuming I can get in at strikes better than what I currently have on, and/or roll out short call if my TP is not hit.

$IBIT - Can you see it?NASDAQ:IBIT could hit $65 in the near future. 👀
As always, I share my opinions and trades. I'm not suggesting anyone follow my trades. You do you.

Opening (IRA): IBIT March 21st 50 Covered Call... for a 47.78 debit.
Comments: High IVR/IV. Selling the -75 call against shares to emulate the delta metrics of a 25 delta short put, but with the built-in defense of the short call.
Metrics:
Buying Power Effect/Break Even: 47.78
Max Profit: 1.22
ROC at Max: 2.55%
50% Max: .61
ROC at 50% Max: 1.28%
Will generally look to take profit at 50% max, add at intervals (assuming I can get in at a break even better than what I currently have on), and/or roll out the short call in the event take profit is not hit.

IBIT - Key Trading Analysis & Gamma - Hot list on RadarTechnical Overview
* Current Price: $59.20
* Key Resistance Levels:
* $60.50: Intermediate resistance. A breakout could signal bullish continuation.
* $61.00 - $63.00: Gamma resistance, indicating strong call option interest.
* Key Support Levels:
* $57.00: Immediate support; maintaining this level is critical for upward momentum.
* $55.00: Critical breakdown level; a loss here may lead to increased bearish momentum.
Price Action Insights
* Recent upward movement indicates a breakout of consolidation from $55.00 support.
* Price is currently trading near $59.00 with bullish bias but needs to sustain above $60.50 for further momentum.
* Higher lows and a wedge breakout signal potential for a run toward $63.00 in the coming sessions.
Gamma Exposure (GEX) Analysis
* Call Walls:
* $60.50: 2nd call wall with 72.55% exposure.
* $63.00: Gamma resistance and potential top for the short term.
* Put Walls:
* $54.50 - $51.00: Strong gamma support area; prices are unlikely to break this range without high volume.
Trading Plan
1. Bullish Scenario:
* Entry: Above $60.50
* Target: $63.00
* Stop-Loss: Below $57.00
2. Bearish Scenario:
* Entry: Below $57.00
* Target: $54.50
* Stop-Loss: Above $60.00
Options Trading Suggestions
* Bullish Strategy:
* Strike Price: $60 Calls (March Expiry)
* Premium Target: $63.00 Gamma Resistance
* Consideration: Monitor volume; ensure price closes above $60.
* Bearish Strategy:
* Strike Price: $55 Puts (March Expiry)
* Premium Target: $54.00 Put Support
* Consideration: Enter only on volume breakdown below $57.
Thoughts on Direction
* Bullish Sentiment dominates, especially above $60, supported by strong call walls.
* A pullback to $57 or lower might create opportunities for bears in the short term.
Disclaimer
This analysis is for educational purposes only and does not constitute financial advice. Market conditions can change rapidly, particularly during the premarket or intraday sessions. Adjust your trading strategy accordingly. For questions or updates, feel free to reach out directly.

Opening (IRA): IBIT February 28th 49.5 Covered Call... for a 47.52 debit.
Comments: High IV/IVR. Back into IBIT on a little bit of weakness here, selling the -75 delta call against shares to emulate the delta metrics of a 25 delta short put, but with the built-in defense of the short call. The March monthly is still a bit long in duration for my tastes, so going with a weekly.
Metrics:
Buying Power Effect/Break Even: 47.52/share
Max Profit: 1.98
ROC at Max: 4.17%
50% Max: .99
ROC at 50% Max: 2.09%
Will generally look to take profit at 50% max, roll out short call on take profit test, add at intervals, assuming I can get in at break evens better than what I currently have on.
