Opening (IRA): IBIT February 21st 47 Covered Call... for a 44.52 debit.
Comments: Adding to my position at strikes/break evens better than what I currently have on, selling the -75 delta strike against shares to emulate the delta metrics of a 25 delta short put, but with the built-in defense of the short call.
Metrics:
Break Even/Buying Power Effect: 44.52/share
Max Profit: 2.48
ROC at Max: 5.57%
50% Max: 1.24
ROC at 50% Max: 2.79%
Will generally look to take profit at 50% max, roll out short call on take profit point test.
IBIT trade ideas

Opening (IRA): IBIT February 21st 50 Covered Call... for a 47.07 debit.
Comments: High IVR/IV (88.4/68.6) + weakness post-FOMC. Going out to February, as there are only 30 DTE left in January, selling the -75 delta call against shares to emulate the delta metrics of a 25 delta short put, but with the built-in defense of the short call. Looking at this as a "starter" position, so will look to add at intervals, assuming I can get in at strikes/break evens better than what I currently have on.
Metrics:
Buying Power Effect/Break Even: 47.07/share
Max Profit: 2.93
ROC at Max: 6.22%
50% Max: 1.47
ROC at 50% Max: 3.11%
Will generally look to take profit at 50% max, roll out short call on take profit point test.

Trading Journal -LOSSBitcoin looked like it was getting ready for another move higher after closing below on 21 EMA on heavy volume.
Not to be the case as it closed below both the 10 EMA and 21 EMA the very next day.
Sold for a loss

Bitcoin Exposure Through the IBIT Basket Fund Why It’s Right to Be Exposed and Invested in Bitcoin and How to Do It Subtly with the IBIT ETF NASDAQ:IBIT
In recent years, Bitcoin has gone from being a niche digital asset to a widely discussed financial instrument.
As it becomes more mainstream, Bitcoin offers a unique opportunity for those looking to get involved in the digital economy, decentralized finance, and potential long-term wealth generation.
But the question remains: *How can you gain exposure to Bitcoin without jumping straight into the volatile nature of investing directly in it?*
For many investors, traditional assets like stocks, bonds, and ETFs offer security and familiarity. But the growing appeal of Bitcoin—due to its potential for high returns and its distinctive qualities—has made it impossible to ignore. A smart yet subtle way to get involved in Bitcoin is by investing in diversified funds like the **IBIT ETF**.
### Why Invest in Bitcoin?
#### 1. **Diversification and Protection Against Inflation**
Bitcoin has shown itself to be a valuable asset in an investment portfolio, particularly during times of economic uncertainty.
Unlike fiat currencies, which can be devalued by inflation or central bank policies, Bitcoin has a finite supply.
There will only ever be 21 million Bitcoins, making it a deflationary asset.
As a result, it’s increasingly viewed as a hedge against inflation, similar to gold.
In times of unpredictable inflation, Bitcoin offers a potential safeguard, much like precious metals have historically done during economic instability.
#### 2. **Potential for Significant Upside**
Bitcoin has the potential for incredible returns, especially over the long run.
Although its volatility is well-known, those who have held onto Bitcoin for several years have seen its value grow substantially.
It’s not just a speculative asset—it's also a digital store of wealth, with new applications emerging in areas such as remittances, smart contracts, and decentralized finance.
For investors who can handle short-term fluctuations, Bitcoin’s long-term potential is promising. As Bitcoin continues to grow in the cryptocurrency ecosystem and gains more legitimacy, its value could continue to rise.
#### 3. **Blockchain Technology and Decentralization**
At its core, Bitcoin represents a revolutionary shift in how we think about and interact with money.
The blockchain technology behind Bitcoin enables secure, transparent transactions without the need for intermediaries like banks or governments.
This decentralization aligns with the growing trends of financial autonomy and privacy, resonating with those who value freedom and control over their financial futures.
Bitcoin’s decentralized nature means it operates independently of any central authority,
which is becoming increasingly important in today’s rapidly changing global financial environment.
### The IBIT ETF: A Subtle Path to Bitcoin Exposure
For investors who want to gain exposure to Bitcoin without directly buying and managing the cryptocurrency, the **IBIT ETF** offers an ideal solution.
This managed fund provides exposure to Bitcoin while diversifying the risk across a mix of related assets.
Here’s why it’s an excellent way to gain Bitcoin exposure in a subtle, safe manner:
#### 1. **Diversification Across Multiple Bitcoin-Related Assets**
Instead of investing in Bitcoin alone, the IBIT Basket Fund allows you to diversify across a range of assets related to the Bitcoin ecosystem.
This might include investments in Bitcoin mining companies, blockchain tech firms, and businesses with significant Bitcoin holdings.
By investing in a basket like this, you reduce the risk associated with the volatility of a single asset, while giving your portfolio broader exposure to the overall growth of the cryptocurrency market.
#### 2. **Professional Management**
A key benefit of the IBIT Basket Fund is the expertise of its professional managers.
Bitcoin, while incredibly promising, can be complex and volatile.
For many investors, managing Bitcoin directly—such as dealing with wallets, private keys, and exchanges—can feel overwhelming.
The IBIT ETF simplifies this by allowing a team of experts to handle the management, ensuring that investors can access Bitcoin and related assets without needing technical knowledge.
#### 3. **Long-Term Growth Potential**
The IBIT ETF is not aimed at short-term speculation; rather, it’s designed to capture Bitcoin’s long-term growth potential and the wider cryptocurrency market.
By investing in Bitcoin-related assets, you’re positioning yourself for long-term gains as Bitcoin matures and further integrates into the global financial system.
The diversified nature of the fund means it remains resilient even in the face of Bitcoin’s short-term volatility.
#### 4. **Subtle Yet Significant Exposure**
Investing in the IBIT ETF gives you Bitcoin exposure in a more subtle way,
without needing to directly purchase or hold the cryptocurrency.
For those who may be cautious about diving into the speculative world of Bitcoin,
this approach provides a bridge to exposure while mitigating risk.
Additionally, Bitcoin’s price movements are still relatively isolated from traditional financial markets, so the IBIT Basket Fund can offer a way to add growth from non-correlated assets to your portfolio.
### How to Invest in the IBIT ETF
1. **Understand Your Risk Tolerance**: Like any investment, it’s important to assess how much risk you’re willing to take.
Bitcoin and related assets are volatile, and their value can fluctuate dramatically in a short time.
Be sure your investment in the IBIT ETF aligns with your broader financial goals and your personal risk profile.
2. **Consult with a Financial Advisor**:
Before making any investment decisions,
it’s always wise to consult with a financial advisor who can help tailor a strategy to your needs. An advisor can help you determine how much Bitcoin exposure is appropriate for your portfolio and ensure that the IBIT ETF fits into your overall financial plan.
3. **Choose the Right Fund**:
Many funds provide exposure to Bitcoin and other crypto assets.
It’s important to research different options, taking into account their risk levels, fees,
and the underlying assets in their portfolios.
This will help you select the IBIT Basket ETF best fits your needs.
4. **Start with a Modest Investment**:
If you’re new to Bitcoin, consider starting with a small investment.
This will allow you to become familiar with the asset class and evaluate how it fits into your portfolio before committing more substantial amounts.
5. **Monitor Performance Regularly**:
While Bitcoin is often viewed as a long-term investment, it’s still crucial to monitor your investment in the IBIT ETF regularly.
Staying informed about the performance of the underlying assets and broader market trends will help you make smart decisions about your investment’s future.
### Conclusion
Bitcoin’s transformative potential as a decentralized asset makes it a compelling option for investors.
However, its inherent volatility may make direct investment intimidating, especially for those unfamiliar with the digital asset world.
The IBIT ETF offers a smart way to gain exposure to Bitcoin without directly managing it yourself.
With professional management, diversification, and the potential for long-term growth, this fund provides a more accessible path for investors looking to tap into Bitcoin’s potential while minimizing risk.
By incorporating Bitcoin exposure through a carefully selected fund, investors can strike a balance between managing risk, achieving long-term growth, and engaging with the future of finance in a smart, controlled way.

IBITUSDT Analysis: Red Box Breakout PotentialIn IBITUSDT, the red box signifies a critical resistance zone. If price breaks and retests this level, it may present a long entry opportunity . That said, my overall expectation is for the correction to deepen further before significant upward movement.
Key Points:
Red Box Resistance: Monitor for a breakout and retest to confirm a potential long setup.
Deeper Correction Likely: Current market conditions suggest the correction could continue before recovery.
Confirmation Indicators: I will utilize CDV, liquidity heatmaps, volume profiles, volume footprints, and upward market structure breaks in lower time frames to validate entries.
Learn With Me: If you want to understand how to leverage CDV, liquidity heatmaps, volume profiles, and volume footprints for accurate market analysis, feel free to DM me.
Reminder: Always manage your risk and look for confirmation before taking any trades.
If this analysis helps you, please don’t forget to boost and comment. Your support inspires me to share more valuable insights!
If you think this analysis helps you, please don't forget to boost and comment on this. These motivate me to share more insights with you!
I keep my charts clean and simple because I believe clarity leads to better decisions.
My approach is built on years of experience and a solid track record. I don’t claim to know it all, but I’m confident in my ability to spot high-probability setups.
If you would like to learn how to use the heatmap, cumulative volume delta and volume footprint techniques that I use below to determine very accurate demand regions, you can send me a private message. I help anyone who wants it completely free of charge.
My Previous Analysis
🐶 DOGEUSDT.P: Next Move
🎨 RENDERUSDT.P: Opportunity of the Month
💎 ETHUSDT.P: Where to Retrace
🟢 BNBUSDT.P: Potential Surge
📊 BTC Dominance: Reaction Zone
🌊 WAVESUSDT.P: Demand Zone Potential
🟣 UNIUSDT.P: Long-Term Trade
🔵 XRPUSDT.P: Entry Zones
🔗 LINKUSDT.P: Follow The River
📈 BTCUSDT.P: Two Key Demand Zones
🟩 POLUSDT: Bullish Momentum
🌟 PENDLEUSDT.P: Where Opportunity Meets Precision
🔥 BTCUSDT.P: Liquidation of Highly Leveraged Longs
🌊 SOLUSDT.P: SOL's Dip - Your Opportunity
🐸 1000PEPEUSDT.P: Prime Bounce Zone Unlocked
🚀 ETHUSDT.P: Set to Explode - Don't Miss This Game Changer
🤖 IQUSDT: Smart Plan
⚡️ PONDUSDT: A Trade Not Taken Is Better Than a Losing One
💼 STMXUSDT: 2 Buying Areas
🐢 TURBOUSDT: Buy Zones and Buyer Presence
🌍 ICPUSDT.P: Massive Upside Potential | Check the Trade Update For Seeing Results
🟠 IDEXUSDT: Spot Buy Area | %26 Profit if You Trade with MSB
📌 USUALUSDT: Buyers Are Active + %70 Profit in Total
🌟 FORTHUSDT: Sniper Entry +%26 Reaction
🐳 QKCUSDT: Sniper Entry +%57 Reaction
📊 BTC.D: Retest of Key Area Highly Likely
I stopped adding to the list because it's kinda tiring to add 5-10 charts in every move but you can check my profile and see that it goes on..

IBIT | Be PatientThe market is declining rapidly, and Bitcoin remains highly volatile, making it dangerous to take risks in the current environment. I have marked the HTF (High Time Frame) demand zones as critical areas to monitor.
Trades should be based on the reactions observed in these demand zones on lower timeframes. This approach helps minimize risk while identifying potential entry points with stronger confirmation.
I keep my charts clean and simple because I believe clarity leads to better decisions.
My approach is built on years of experience and a solid track record. I don’t claim to know it all, but I’m confident in my ability to spot high-probability setups.
My Previous Analysis
🐶 DOGEUSDT.P: Next Move
🎨 RENDERUSDT.P: Opportunity of the Month
💎 ETHUSDT.P: Where to Retrace
🟢 BNBUSDT.P: Potential Surge
📊 BTC Dominance: Reaction Zone
🌊 WAVESUSDT.P: Demand Zone Potential
🟣 UNIUSDT.P: Long-Term Trade
🔵 XRPUSDT.P: Entry Zones
🔗 LINKUSDT.P: Follow The River
📈 BTCUSDT.P: Two Key Demand Zones
🟩 POLUSDT: Bullish Momentum
🌟 PENDLEUSDT.P: Where Opportunity Meets Precision
🔥 BTCUSDT.P: Liquidation of Highly Leveraged Longs
🌊 SOLUSDT.P: SOL's Dip - Your Opportunity
🐸 1000PEPEUSDT.P: Prime Bounce Zone Unlocked
🚀 ETHUSDT.P: Set to Explode - Don't Miss This Game Changer
🤖 IQUSDT: Smart Plan
⚡️ PONDUSDT: A Trade Not Taken Is Better Than a Losing One
💼 STMXUSDT: 2 Buying Areas
🐢 TURBOUSDT: Buy Zones and Buyer Presence
🌍 ICPUSDT.P: Massive Upside Potential | Check the Trade Update For Seeing Results
🟠 IDEXUSDT: Spot Buy Area | %26 Profit if You Trade with MSB
📌 USUALUSDT: Buyers Are Active + %70 Profit in Total

Long $IBIT, but be patientThis is a weekly chart of NASDAQ:IBIT , which allows convenient exposure to BTC via traditional brokerages. Since the Trump election euphoria has waned a bit, we are now seeing a retracement, which, based on the Fibonacci framework I use will offer an excellent long entry around the $45 level, should it get there. That would be just above the 50% Fib retracement level and would fill a gap (indicated by the green rectangle). With many catalysts/macro factors at play it is my opinion that exposure to BTC would be prudent for every investor, and this price level would be a gift if it gets there. Merry Christmas.

IBIT Bitcoin Trust ETF Technical Analysis Trade This chart highlights a parabolic uptrend in IBIT, with price making a significant move from consolidation to new highs. The chart includes pivot levels (S1, R1, R2), dark pool levels, moving averages (8 EMA and 21 EMA), and volume, all of which help in understanding the current price action and predicting potential moves.
Key Observations:
1. Trend Structure:
The chart shows a strong uptrend supported by the 8 EMA and 21 EMA.
A breakout above the 61.99 resistance (R1) occurred recently, but price has since pulled back slightly, consolidating near 56.10, which aligns with a dark pool level.
2. Support and Resistance:
Resistance Levels:
61.99 (R1): The key breakout level, which price is currently retesting as resistance.
68.77 (R2): The next significant resistance and a long-term target for bulls.
Support Levels:
56.10: A dark pool level and immediate support zone.
53.00: Key short-term support near the 21 EMA.
47.30 (S1): A deeper support level in case of a larger pullback.
3. Volume Analysis:
A high volume breakout occurred recently, suggesting strong interest from institutions or retail traders.
However, recent volume bars are slightly lower, indicating that the bullish momentum is consolidating. This could lead to either a continuation higher or a pullback to support.
4. Moving Averages:
The 8 EMA is currently acting as immediate dynamic support, while the 21 EMA (~53.00) provides a secondary layer of support.
As long as the price remains above these moving averages, the uptrend remains intact.
Trade Setup:
Scenario 1: Bullish Continuation
Trigger: A breakout above 61.99 (R1) on high volume would confirm bullish continuation.
Profit Targets:
68.77 (R2): The next major resistance level.
70-75: A potential extension zone in a strong parabolic move.
Stop-Loss: Below 56.10, as a break below this level would signal a loss of bullish momentum.
Scenario 2: Pullback to Support
Trigger: If price fails to break above 61.99 and pulls back, look for buying opportunities near:
56.10 (dark pool level): Immediate support.
53.00 (21 EMA): A stronger support level for a bounce.
Profit Targets:
61.99: Retest of the breakout level.
68.77 (R2): Higher target if the trend resumes.
Stop-Loss: Below 52, as this would indicate a breakdown below the key EMAs.
Scenario 3: Bearish Breakdown
Trigger: A strong close below 53.00 with high volume would signal bearish momentum.
Profit Targets:
47.30 (S1): First major pivot support.
41.00-43.00: A retest of previous consolidation levels.
Stop-Loss: Above 56.10, as a reclaim of this level would invalidate the bearish thesis.
Final Thoughts:
Short-Term Outlook: Consolidation near 56.10 suggests the potential for either a breakout above 61.99 or a pullback to key support zones.
Long-Term Outlook: The parabolic nature of the trend suggests strong bullish sentiment, with deeper pullbacks offering opportunities to re-enter the trend.
Watch volume closely to confirm either a breakout or a breakdown, as institutional activity (dark pool levels) will likely play a significant role.

Opening (IRA): IBIT Jan 17th 50 Covered Call... for a 47.76 debit.
Comments: High IV at 65.3%. Selling the -75 call against stock to emulate the delta metrics of a 25 delta short put, but with the built-in defense of the short call. This isn't the best entry (an understatement), but am looking at it as a starter position which I will add to, assuming I can get in at strikes/break evens better than what I currently have on.
Previously, I was working BITO due to its monthly dividend, but it suffers from "rollover risk" and BITO IV is higher on the put side than on the call, making selling puts more productive in that instrument, kind of defeating the reason why you might want to be in that instrument -- the dividends, for which you have to be in stock.
IBIT IV is higher on the call side than BITO, making covered calls more productive from a max profit standpoint. (The max of the Jan 17th 50 short put, 24 delta, is 1.77 here versus 2.24 for the monied covered call). Alas, the trade-off is ... no dividends.
Metrics:
Buying Power Effect/Break Even: 47.76/share
Max Profit: 2.24
ROC at Max: 4.70%
50% Max: 1.12
ROC at 50% Max: 2.35%
Will generally look to take profit at 50% max; roll the short call out on break of my take profit (which is (50.00 - 47.76)/2 + 47.76 or 48.88.

Opening (IRA): IBIT January 17th 48 Covered Call... for a 46.16 debit.
Comments: Adding to my IBIT position at a strike/break even better than what I currently have on, selling the -75 delta call against shares to emulate the delta metrics of a 25 delta short put to take advantage of call side IV skew and to have the built-in defense of the short call.
Metrics:
Buying Power Effect/Break Even: 46.16/share
Max Profit: 1.84
ROC at Max: 3.99%
50% Max: .92
ROC at 50% Max: 1.99%
Will generally look to take profit at 50% max/roll out short call on break even or take profit test.

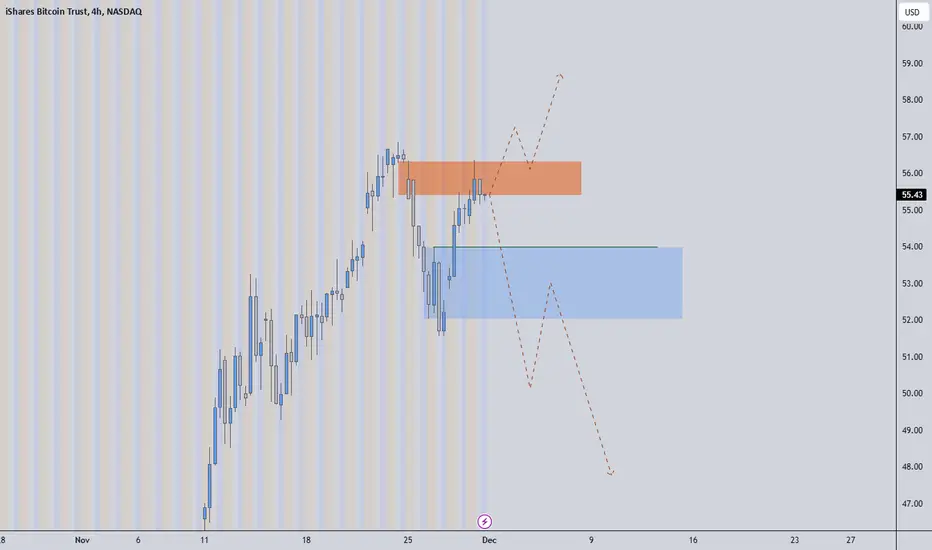
Orange Breaks, We Fly. Blue Falls, We Dive. The chart highlights two critical regions, each playing a pivotal role in determining the next trend direction for IBIT Bitcoin shares:
Orange Box - Key Resistance Zone
The orange box represents a crucial resistance area. For the rally to sustain momentum and push higher, this region must be decisively broken and secured. A close above this level, coupled with strong volume, would indicate the bulls are in control, signaling a potential continuation of the upward trend.
Blue Box - Key Support Zone
The blue box acts as a significant support level. Should the price fall below this zone, it would suggest weakness in the market. A confirmed breakdown, followed by a retest of the orange box from below, provides an opportunity to take a short position, as this would signal the onset of a downtrend.
Conclusion:
These zones are pivotal for the current market structure. Traders should closely monitor price action around these levels to identify whether the market leans towards bullish continuation or bearish reversal.
Blackrock ETF BITCOIN wave 4 of 5 of 3 Ended 60 target long callThe chart is that of blackrock bitcoin etf we seem to have ended minor wave 4 today look for a wave 5 to 60 to exit best of trades WAVETIMER

IBIT | This is Where Real Trader's are LookingThere's no need to complicate things. You are watching where real traders watch.
I see the green box and the red box as the selling place.
When the price reaches those areas, I recommend you to follow the volume side. If these regions are to be broken and passed, the volume side will give signals of this.
-
My Record Speaks for Itself
DOGEUSDT.P | 4 Reward for 1 Risk much more if you hold it.
RENDERUSDT.P | HTF Accuracy
ETHUSDT.P | Accurate Buyer Zone Identification | High Risk Reward if you hold it.
BNBUSDT.P | Accurate Buyer Zone Identification | High Risk Reward if you hold it.
Bitcoin Dominance | Great Characteristic Detection and Accurate Analysis

IBIT breakout first day of options tradingIBIT is breaking out alongside BTC (obviously) this will be my new way of trading BTC, I have been waiting for this for years. If you look at my BTC chart this is the same idea.
My plan:
Bought shares of IBIT at open, will sell covered calls around 100k BTC
Long call spreads Jan 2025 60/65$

You're not buying Bitcoin because it's too expensive. Boomers...are buying IBIT at 39
thinking it can hit 100
welcome to unit bias
something to think about
Just a thought that popped into my head..

$IBIT November 7, 2024NASDAQ:IBIT November 7, 2024
Weekly.
First time we have a close above all highs and near top of bar too.
We have to wait and see Friday Close.
For the last rise 33.47 to 43.63 holding 38.5 to 39 is important.
I entered around 40 levels.
Holding for a target 48 initially. After consolidation in that level i expect a good move.

IBIT:Why are elites buying Bitcoin?Why are elites buying Bitcoin?
Bitcoin has evolved from a cryptocurrency experiment to an asset of global interest, attracting the attention of large financial institutions and elites. This shift in perception, backed by reports such as BlackRock's, highlights how Bitcoin has evolved to become a solid option for protecting capital and diversifying portfolios. But what really motivates elites to invest in Bitcoin?
Bitcoin as a hedge against inflation
Inflation, driven by expansionary monetary policies and increasing money issuance, has become a major concern for high-end investors. Bitcoin, having a limited supply of 21 million units, acts as a store of value that cannot be devalued by an increase in supply, as is the case with fiat currencies. This feature makes Bitcoin an attractive option for those seeking to protect their wealth over the long term in an environment of rising inflation (BlackRock, 2023).
Decentralization and Resilience: A Refuge in Times of Uncertainty
Unlike traditional currencies and other assets that depend on government policies and economic stability, Bitcoin operates independently of central bank and government decisions. This gives it a unique resilience in times of instability. As BlackRock highlights, Bitcoin's decentralized nature makes it an ideal tool for those seeking financial autonomy and protection from state intervention. In a context of global uncertainty, this feature is especially attractive to investors seeking safe assets that are uncorrelated to the traditional financial system (BlackRock, 2023).
The Role of Institutional Adoption
The growing adoption of Bitcoin by financial institutions and investment funds has been instrumental in legitimizing the digital asset. In its report, BlackRock mentions how the entry of institutional investors into the Bitcoin market not only increases its credibility, but also reduces long-term volatility. This trend is relevant because it encourages other high-profile players to explore Bitcoin, seeing it as a less risky and increasingly stable asset. The involvement of institutions such as BlackRock and other investment funds also provides an endorsement that incentivizes elites to consider Bitcoin in their portfolios.
Portfolio Diversification and Long-Term Growth Potential
Bitcoin is an asset that is uncorrelated to traditional stock or bond markets, making it a strategic diversification option. According to BlackRock, in a volatile economic environment, this diversification capability is key to mitigating risks. Moreover, as an asset still in a growth phase, Bitcoin has significant appreciation potential. Its global adoption is still limited, which for many investors represents an opportunity to position themselves before its value stabilizes with wider adoption.
Conclusion: Bitcoin as Risk and Growth Management
For financial elites, Bitcoin offers a combination of protection, growth and diversification. Interest in this asset lies not only in its ability to offer attractive returns, but also in its role as a risk management tool in an increasingly uncertain economic environment. As BlackRock highlights, investing in Bitcoin represents a strategic step both to protect capital against inflation and to participate in an emerging financial trend that promises to transform markets globally.
Ion Jauregui - ActivTrades Analyst
References:
• BlackRock (2023). Bitcoin institutional adoption report.
*******************************************************************************************
The information provided does not constitute investment research. The material has not been prepared in accordance with the legal requirements designed to promote the independence of investment research and such should be considered a marketing communication.
All information has been prepared by ActivTrades ("AT"). The information does not contain a record of AT's prices, or an offer of or solicitation for a transaction in any financial instrument. No representation or warranty is given as to the accuracy or completeness of this information.
Any material provided does not have regard to the specific investment objective and financial situation of any person who may receive it. Past performance is not reliable indicator of future performance. AT provides an execution-only service. Consequently, any person acing on the information provided does so at their own risk.

Understanding Bitcoin ETFs: What They Are and Why They Matter?1. What is a Bitcoin ETF?
A Bitcoin Exchange-Traded Fund (ETF) is a financial instrument that tracks the value of Bitcoin and allows investors to gain exposure to the cryptocurrency without directly owning it. Bitcoin ETFs operate similarly to traditional ETFs, which track the value of assets like stocks, commodities, or indices. Managed by financial institutions, Bitcoin ETFs are available on traditional stock exchanges, making it easier for investors to participate in Bitcoin’s price movements through regular brokerage accounts.
There are two main types of Bitcoin ETFs:
Spot Bitcoin ETFs: Track the current market price of Bitcoin, directly reflecting its value.
Futures-based Bitcoin ETFs: Track the value of Bitcoin futures contracts, which are agreements to buy or sell Bitcoin at a predetermined price at a specified time in the future.
In the U.S., Bitcoin futures ETFs have been approved and launched on major exchanges like the New York Stock Exchange (NYSE), while spot Bitcoin ETFs are still under regulatory review by the Securities and Exchange Commission (SEC).
2. How Does a Bitcoin ETF Differ from Buying Bitcoin Directly?
While both Bitcoin ETFs and direct Bitcoin purchases provide exposure to Bitcoin’s value, they differ in several key ways:
Ownership and Custody
Bitcoin ETFs: Investors own shares in the ETF, but not the actual Bitcoin itself. The ETF provider holds the underlying Bitcoin or Bitcoin futures contracts, taking on the responsibility of secure custody.
Direct Bitcoin Purchase: Investors who buy Bitcoin directly through cryptocurrency exchanges or wallets own the Bitcoin and have full control over it, including the responsibility for secure storage.
Access and Regulatory Oversight
Bitcoin ETFs: Are traded on traditional stock exchanges and are regulated by financial authorities. This oversight ensures investor protections that are not typically present in cryptocurrency markets.
Direct Bitcoin Purchase: Involves buying from cryptocurrency exchanges, many of which are less regulated and may lack certain protections offered by traditional financial products.
Trading Hours
Bitcoin ETFs: Trade during standard market hours, typically from 9:30 AM to 4:00 PM EST. Investors can buy or sell shares only within these hours.
Direct Bitcoin Purchase: Bitcoin can be traded 24/7, giving investors the flexibility to enter or exit positions at any time.
Taxation and Fees
Bitcoin ETFs: Investors are subject to capital gains taxes and may also incur management fees for ETF administration.
Direct Bitcoin Purchase: Direct Bitcoin investors are also subject to capital gains taxes. However, they may face lower or no management fees, depending on how they store their Bitcoin.
Use of Leverage and Derivatives
Bitcoin Futures ETFs: These funds allow investors to speculate on Bitcoin’s future price movements without holding actual Bitcoin. However, futures-based ETFs can be more complex, as they rely on futures contracts rather than spot prices, which can introduce tracking errors.
Direct Bitcoin Purchase: Investors buy Bitcoin directly, holding actual units of the asset without derivatives or leverage, providing a more straightforward exposure to its current market price.
3. Why is a Bitcoin ETF Important for the Cryptocurrency Market?
The approval of a Bitcoin ETF is a significant milestone for the cryptocurrency market for several reasons:
1. Broader Accessibility
Traditional Investors: A Bitcoin ETF opens the door to traditional investors, especially those who may not be comfortable using cryptocurrency exchanges. Investors can access Bitcoin exposure through familiar brokerage accounts without needing to learn about wallets or private keys.
Institutional Interest: A Bitcoin ETF creates an easier path for institutional investors to participate in the Bitcoin market, bringing in large amounts of capital. As institutions enter the market, Bitcoin's market liquidity and price stability may improve.
2. Increased Legitimacy
The introduction of a Bitcoin ETF legitimizes Bitcoin as an asset class in the eyes of regulators, investors, and financial institutions. It signals recognition from regulatory bodies and increases trust in Bitcoin among mainstream investors.
3. Boost to Market Liquidity
Bitcoin ETFs can increase liquidity in the market, as they provide a regulated and accessible means for both retail and institutional investors to gain Bitcoin exposure. Greater liquidity can reduce volatility, making the market more stable over time.
4. Potential for Price Appreciation
With increased demand and accessibility, a Bitcoin ETF could lead to upward price pressure on Bitcoin. This is especially relevant for spot ETFs, which would require the fund to hold actual Bitcoin, thus increasing demand for the underlying asset.
5. Step Toward Broader Cryptocurrency ETF Adoption
Approval of a Bitcoin ETF could pave the way for ETFs focused on other cryptocurrencies like Ethereum or Solana, expanding the options for crypto exposure within traditional markets. This could accelerate the overall growth of the cryptocurrency sector.
4. Pros and Cons of Bitcoin ETFs
While Bitcoin ETFs offer numerous benefits, they also come with certain drawbacks.
Advantages of Bitcoin ETFs
Ease of Access: ETFs are easily accessible through traditional brokerage accounts, removing the need for new accounts on cryptocurrency exchanges.
Regulatory Protections: ETFs are regulated by financial authorities, providing investors with protections that may be absent on cryptocurrency exchanges.
Enhanced Liquidity: Increased market liquidity through ETF participation can reduce volatility and provide a more stable trading environment for Bitcoin.
Professional Custody: ETF providers manage Bitcoin custody and security, making it easier for investors who do not want to worry about wallet security or private key management.
Diversification Opportunities: Bitcoin ETFs can be included in retirement accounts or blended into traditional investment portfolios, broadening their appeal as a tool for diversification.
Disadvantages of Bitcoin ETFs
Limited Trading Hours: ETFs can only be traded during standard market hours, unlike Bitcoin, which is available 24/7 on cryptocurrency exchanges.
Management Fees: Most Bitcoin ETFs come with annual management fees, which can reduce overall returns for investors.
Potential for Tracking Errors: In futures-based ETFs, tracking errors may occur, meaning the ETF's performance may not accurately match Bitcoin’s actual price movements.
No Direct Ownership of Bitcoin: ETF investors do not own Bitcoin itself, which means they miss out on the ability to use or transfer the asset directly.
Market Dependency on Regulators: The introduction and ongoing success of Bitcoin ETFs depend on regulators’ willingness to approve and support crypto-based financial products, which may limit the ETF market’s expansion.
5. Outlook and Future of Bitcoin ETFs
The potential approval of a spot Bitcoin ETF in the U.S. could be a game-changer. With increased institutional and retail access, the Bitcoin ETF market could drive greater adoption and legitimacy for cryptocurrencies overall. However, regulatory challenges remain, as the SEC has thus far resisted approving spot Bitcoin ETFs due to concerns about market manipulation and lack of robust investor protections.
As regulatory clarity improves, we may see a broader array of crypto-based ETFs emerge, possibly including multi-asset ETFs that combine Bitcoin with other cryptocurrencies or assets, such as stocks or commodities. Furthermore, as institutional adoption grows, the role of ETFs in the financial ecosystem could increase, potentially influencing Bitcoin’s price dynamics and volatility as well.
Conclusion
Bitcoin ETFs represent a bridge between the traditional financial world and the emerging cryptocurrency market. While they offer unique advantages, such as regulatory protections and ease of access, they also come with limitations like management fees, limited trading hours, and the lack of direct ownership. For those who want exposure to Bitcoin within the security of a regulated investment product, Bitcoin ETFs provide a promising option.
The success and potential of Bitcoin ETFs lie in their ability to draw both individual and institutional investors into the cryptocurrency market, making it a potentially transformative development for the financial world. As more countries consider ETF approval, and as the cryptocurrency industry matures, Bitcoin ETFs could play a pivotal role in the mainstream adoption and integration of digital assets.
Hope you enjoyed the content I created, You can support with your likes and comments this idea so more people can watch!
✅Disclaimer: Please be aware of the risks involved in trading. This idea was made for educational purposes only not for financial Investment Purposes.
---
• Look at my ideas about interesting altcoins in the related section down below ↓
• For more ideas please hit "Like" and "Follow"!

To turn into a short-term uptrend, it needs to rise above 34.18
Hello, traders.
If you "Follow", you can always get new information quickly.
Please also click "Boost".
Have a nice day today.
-------------------------------------
Let's check out the chart with the highest trading volume among the released BTC ETF products.
(IBIT 1M chart)
However, since the chart has just been created, the role of the indicated support and resistance points may be weak, so caution is required.
-
(1W chart)
The point where the volume profile section is formed on the current chart is 38.14.
Therefore, it is expected that the uptrend will begin only when it rises above the volume profile section.
-
(1D chart)
The key is whether it can maintain the price by receiving support and resistance formed at the 32.70 point and rising above 34.18 (if possible, Fibonacci ratio 0.618 (34.68)).
Therefore, it is necessary to check whether it can break through the psychological volume profile section of the first gate, 32.85-33.41 section.
-
From a trend perspective, it is necessary to break away from the downtrend line (1) in order to turn into an uptrend.
Accordingly, it is necessary to check whether it can lead to a movement to change the state from M-Signal on the 1D chart > M-Signal on the 1W chart.
If it fails to turn, you should check for support around 23.99-26.03.
-
Based on the current price position, it is expected that a full-scale uptrend will begin when it rises above the HA-High indicator (39.87) on the 1D chart.
Since the HA-Low indicator on the 1D chart has not been created yet on the current chart, if it starts to fall below 32.67, it seems likely that the HA-Low indicator will be created.
If the HA-Low indicator is created, the key point is whether there is support around that area.
-
Have a good time.
Thank you.
--------------------------------------------------
- Big picture
It is expected that a full-scale uptrend will begin when it rises above 29K.
The area expected to be touched in the next bull market is 81K-95K.
#BTCUSD 12M
1st: 44234.54
2nd: 61383.23
3rd: 89126.41
101875.70-106275.10 (overshooting)
4th: 13401.28
151166.97-157451.83 (overshooting)
5th: 178910.15
These are points where resistance is likely to occur in the future.
We need to check if these points can be broken upward.
We need to check the movement when this section is touched because I think a new trend can be created in the overshooting section.
#BTCUSD 1M
If the major uptrend continues until 2025, it is expected to start forming a pull back pattern after rising to around 57014.33.
1st: 43833.05
2nd: 32992.55
-----------------

$IBIT 4-Hour Chart Gaps Continue to Fill and Leave Clues for BTCThis new leading 'indicator' for lack of a better term, continues to be accurate and 100% since the NASDAQ:IBIT inception. Every single gap has filled, except one recent one which I believe will resolve to the downside at some point below.
The 2nd IBIT Gap just filled on this mini-rally today, so I think we head lower to fill the other lower unfilled gap as noted.
Although it's showing a nice hammer reversal candle and Bullish Engulfing candle here.
So If it breaks and holds above $33, then we likely push higher for a time.
There's no time limit for filling these gaps unfortunately.
But I think we'll re-test recent price action on Bitcoin around GETTEX:54K , which would be a nice buying opportunity.
Unless the markets continue to get spooked with election / econonomy fears.
Also, since the CPI came in as expected there's less reason for the FED to drop rates .50 basis points which is what I thought could be a short term catalyst to rally prices. As of today's CPI news, there's an 85% chance of just a .25 basis point cut.
I can't foresee any positive bullish news in the short term, so I'm expecting September to continue to be rangebound, choppy, and re-test recent lows.
BTC.D does look bullish here, so I'm focusing attention on Bitcoin and SOL buying zones mostly.
Really curious to see if and how long this 4-hour NASDAQ:IBIT chart and 'gap trading' continues to work...
Shhhhh, for now I've found something new that's working :)
Feel free to like and share.
More info in my bio.
- Brett

$IBIT Gap Filled As Forecast (New Leading Bitcoin Indicator?)Proof that this works?
So far it's 100% accurate.
Every single 'Gap' on the NASDAQ:IBIT 4-Hour chart has filled.
Refer back to my prior videos showing this, and while this does NOT mean it will continue to work forever... It's certainly a curious anomoly.
And likely works based on the same principals as the CME gaps which typically fill 99% of the time (There's still an unfilled gap on the Bitcoin CME at $9750 as I recall). But who's counting.
Going forward, I'll be using this as an additional guide to where price may be heading and potentially reversing to, before resuming trent.
Like and share this with your other trader friends, as this has been very interesting to monitor!

BlackRock Bitcoin ETF Is Forming An Intraday Bullish SetupIf we take a look at the hourly chart of BlackRock Bitcoin ETF with ticker IBIT, we can see nice and clean five-wave intraday rally from the lows, followed by an a-b-c corrective setback with first support at 32 area, while second deeper one would be around 31 area. So, seems like it's forming a nice intraday bullish setup formation, thus watch out on a bullish continuation, while it's above 28 invalidation level, just keep in mind that bulls may step in above 34.15 level.

New IBIT Downside Gap To Fill Signaling Bitcoin RetracementWe have been following the BlackRock NASDAQ:IBIT 1 Hour and 4 hour chart since it was released earlier this year, and noticing that...
Like the CME chart gaps, the IBIT chart gaps also similarly seem to fill.
EVERY ONE SO FAR.
So I'm now eyeing this lower gap to fill, and since the IBIT tends to be a leading signal to Bitcoin price, I'm expecting Bitcoin to drift lower to re-test recent lows before heading higher again.
