Short- Term Bottom Forming in ICleanICLN could get a bounce in short term from buyers at 11 dollar mark. Longer term trend suggests some more pain for ICLN. However, ICLN's starting to looking oversold on RSI.
Keeping an eye on this. Interested in adding a long when/if price action enters green channel.
Key stats
About iShares Global Clean Energy ETF
Home page
Inception date
Jun 24, 2008
Structure
Open-Ended Fund
Replication method
Physical
Dividend treatment
Distributes
Distribution tax treatment
Qualified dividends
Income tax type
Capital Gains
Max ST capital gains rate
39.60%
Max LT capital gains rate
20.00%
Primary advisor
BlackRock Fund Advisors
Distributor
BlackRock Investments LLC
ICLN invests in global clean energy companies, which is defined as those involved in the biofuels, ethanol, geothermal, hydroelectric, solar, and wind industries. Aside from holding companies that produce energy through these means, ICLN also includes companies that develop technology and equipment used in the process. Selected by the index committee, the fund is weighted by market-cap and exposure score subject to several constraints and reconstituted semi-annually. Prior to April 19, 2021, the index followed a more narrow methodology.
Related funds
Classification
What's in the fund
Exposure type
Utilities
Electronic Technology
Producer Manufacturing
Stock breakdown by region
Top 10 holdings

ICLN - ISHARES GLOBAL CLEAN ENERGY ETF - USD Simply go long, it's the future! If the USA doesn't want to increase this ETF by 20 or 30 or 40%, the world will end up on its last legs! NVDA won't save the planet!
ENPH
Enphase Energy, Inc. 7.93%
FSLR
First Solar, Inc. 7.36%
ED
Consolidated Edison, Inc. 6.34%
IBE.MC
Iberdrola, S.A. 6.02%
VWS

Clean Energy ETF $ICLNResistances and Support
3 month candles
Possible bottom looks like it could be in with rising volume

Clean EnergyThe transition to clean energy has been happening but at a slower pace. Fossil fuel is here to stay for years to come since our survival heavily depends on its byproducts. The iShare Clean Energy ETF will trach this transition as we increase the adoption of clean/renewable energy.
The ETF is heavi

ICLN etf nice look here. With solar running hot I've got me eye on this Global Clean energy ETF with big holdings in ENPH (8.9%) SEDG (8.2%) and FSLR (8.2%) Clean looking wedge pattern here on the daily. Not a lot of ATR on this one but could set up for a nice swing. Watching for a breakout of that 20 spot if solar continue

ICLN Bullish inclined naked puts 14 Oct expiryWhats The Plan/Trade/Thought
ICLN is one of the 3 largest renewable energy ETF’s by assets under management. These 3 ETFs all have a significant holding on to stock ENPH. So it almost acts like an insulated ENPH proxy.
ICLN generally follows the S&P and the drops a less drastic. The recent 6%

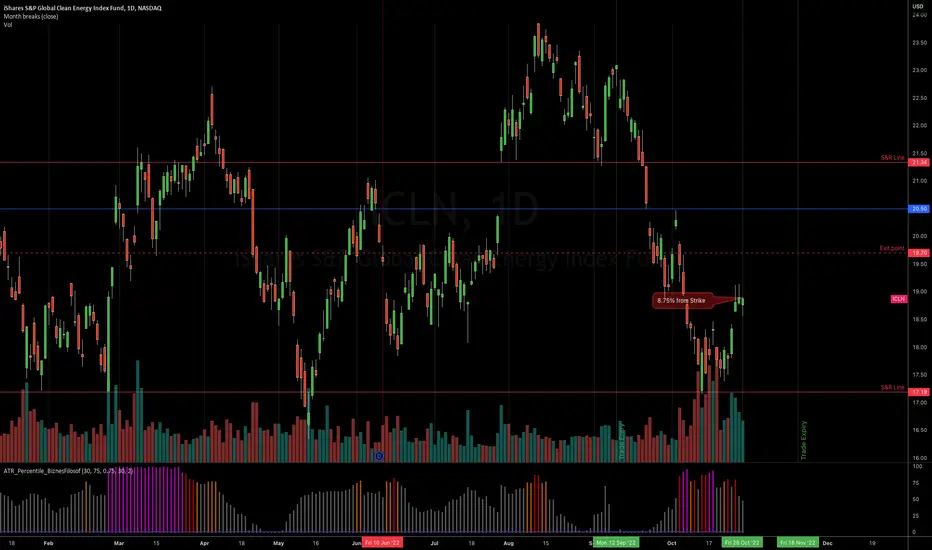
ICLN Bearish inclined naked calls 18 Nov expiry
Whats The Plan/Trade/Thought
ICLN is an ETF filled with companies that will rely heavily on bank loans to operate, this would probably result in accelerated dips with the increasing interest rates
Risk Mitigation
I see 19.70 as my indicator that my direction is wrong and I should exit
Can
ICLN - Global Clean Energy ETF - LongPrices are trading in a corrective formation ahead of an impulse upward 5th wave. The next move will drive the market higher to 25.20, 25.50 and 26.10. We would recommend building long positions at market with a take profit at 25.20/50.
A daily close below 20.00 would invalidate the upward scenario


Global Clean Energy READY TO TAKE OFF?!Energy dependent Nations looking for new sources of energy primarily clean Energy. The Bipartisan Infrastructure Law and the Energy Act of 2020 provides over $60 billion primarily for new major clean energy demonstration and deployment programs and more than triples DOE’s annual funding for energy p

See all ideas
Summarizing what the indicators are suggesting.
Oscillators
Neutral
SellBuy
Strong sellStrong buy
Strong sellSellNeutralBuyStrong buy
Oscillators
Neutral
SellBuy
Strong sellStrong buy
Strong sellSellNeutralBuyStrong buy
Summary
Neutral
SellBuy
Strong sellStrong buy
Strong sellSellNeutralBuyStrong buy
Summary
Neutral
SellBuy
Strong sellStrong buy
Strong sellSellNeutralBuyStrong buy
Summary
Neutral
SellBuy
Strong sellStrong buy
Strong sellSellNeutralBuyStrong buy
Moving Averages
Neutral
SellBuy
Strong sellStrong buy
Strong sellSellNeutralBuyStrong buy
Moving Averages
Neutral
SellBuy
Strong sellStrong buy
Strong sellSellNeutralBuyStrong buy
Displays a symbol's price movements over previous years to identify recurring trends.
Frequently Asked Questions
An exchange-traded fund (ETF) is a collection of assets (stocks, bonds, commodities, etc.) that track an underlying index and can be bought on an exchange like individual stocks.
ICLN trades at 13.72 USD today, its price has fallen −1.22% in the past 24 hours. Track more dynamics on ICLN price chart.
ICLN net asset value is 13.78 today — it's risen 5.82% over the past month. NAV represents the total value of the fund's assets less liabilities and serves as a gauge of the fund's performance.
ICLN assets under management is 1.50 B USD. AUM is an important metric as it reflects the fund's size and can serve as a gauge of how successful the fund is in attracting investors, which, in its turn, can influence decision-making.
ICLN price has risen by 5.18% over the last month, and its yearly performance shows a −2.76% decrease. See more dynamics on ICLN price chart.
NAV returns, another gauge of an ETF dynamics, showed a 16.81% increase in three-month performance and has decreased by −0.38% in a year.
NAV returns, another gauge of an ETF dynamics, showed a 16.81% increase in three-month performance and has decreased by −0.38% in a year.
ICLN fund flows account for −548.92 M USD (1 year). Many traders use this metric to get insight into investors' sentiment and evaluate whether it's time to buy or sell the fund.
Since ETFs work like an individual stock, they can be bought and sold on exchanges (e.g. NASDAQ, NYSE, EURONEXT). As it happens with stocks, you need to select a brokerage to access trading. Explore our list of available brokers to find the one to help execute your strategies. Don't forget to do your research before getting to trading. Explore ETFs metrics in our ETF screener to find a reliable opportunity.
ICLN invests in stocks. See more details in our Analysis section.
ICLN expense ratio is 0.41%. It's an important metric for helping traders understand the fund's operating costs relative to assets and how expensive it would be to hold the fund.
No, ICLN isn't leveraged, meaning it doesn't use borrowings or financial derivatives to magnify the performance of the underlying assets or index it follows.
In some ways, ETFs are safe investments, but in a broader sense, they're not safer than any other asset, so it's crucial to analyze a fund before investing. But if your research gives a vague answer, you can always refer to technical analysis.
Today, ICLN technical analysis shows the buy rating and its 1-week rating is buy. Since market conditions are prone to changes, it's worth looking a bit further into the future — according to the 1-month rating ICLN shows the neutral signal. See more of ICLN technicals for a more comprehensive analysis.
Today, ICLN technical analysis shows the buy rating and its 1-week rating is buy. Since market conditions are prone to changes, it's worth looking a bit further into the future — according to the 1-month rating ICLN shows the neutral signal. See more of ICLN technicals for a more comprehensive analysis.
Yes, ICLN pays dividends to its holders with the dividend yield of 1.15%.
ICLN trades at a premium (0.17%).
Premium/discount to NAV expresses the difference between the ETF’s price and its NAV value. A positive percentage indicates a premium, meaning the ETF trades at a higher price than the calculated NAV. Conversely, a negative percentage indicates a discount, suggesting the ETF trades at a lower price than NAV.
Premium/discount to NAV expresses the difference between the ETF’s price and its NAV value. A positive percentage indicates a premium, meaning the ETF trades at a higher price than the calculated NAV. Conversely, a negative percentage indicates a discount, suggesting the ETF trades at a lower price than NAV.
ICLN shares are issued by BlackRock, Inc.
ICLN follows the S&P Global Clean Energy Transition Index - Benchmark TR Net. ETFs usually track some benchmark seeking to replicate its performance and guide asset selection and objectives.
The fund started trading on Jun 24, 2008.
The fund's management style is passive, meaning it's aiming to replicate the performance of the underlying index by holding assets in the same proportions as the index. The goal is to match the index's returns.