Short- Term Bottom Forming in ICleanICLN could get a bounce in short term from buyers at 11 dollar mark. Longer term trend suggests some more pain for ICLN. However, ICLN's starting to looking oversold on RSI.
Keeping an eye on this. Interested in adding a long when/if price action enters green channel.
ICLN trade ideas

ICLN - ISHARES GLOBAL CLEAN ENERGY ETF - USD Simply go long, it's the future! If the USA doesn't want to increase this ETF by 20 or 30 or 40%, the world will end up on its last legs! NVDA won't save the planet!
ENPH
Enphase Energy, Inc. 7.93%
FSLR
First Solar, Inc. 7.36%
ED
Consolidated Edison, Inc. 6.34%
IBE.MC
Iberdrola, S.A. 6.02%
VWS.CO
Vestas Wind Systems A/S 5.83%
600900.SS
China Yangtze Power Co., Ltd. 4.09%
EDP.LS
EDP, S.A. 4.01%
9502.T
Chubu Electric Power Company, Incorporated 3.81%
ORSTED.CO
Ørsted A/S 3.74%
SUZLON.BO
Suzlon Energy Limited 3.17%

Clean Energy ETF $ICLNResistances and Support
3 month candles
Possible bottom looks like it could be in with rising volume

Clean EnergyThe transition to clean energy has been happening but at a slower pace. Fossil fuel is here to stay for years to come since our survival heavily depends on its byproducts. The iShare Clean Energy ETF will trach this transition as we increase the adoption of clean/renewable energy.
The ETF is heavily discounted going forward and the price is not trading far from pre-covid levels despite the adoption of clean energy increasing significantly since late 2019.

ICLN etf nice look here. With solar running hot I've got me eye on this Global Clean energy ETF with big holdings in ENPH (8.9%) SEDG (8.2%) and FSLR (8.2%) Clean looking wedge pattern here on the daily. Not a lot of ATR on this one but could set up for a nice swing. Watching for a breakout of that 20 spot if solar continue to run.

ICLN Bullish inclined naked puts 14 Oct expiryWhats The Plan/Trade/Thought
ICLN is one of the 3 largest renewable energy ETF’s by assets under management. These 3 ETFs all have a significant holding on to stock ENPH. So it almost acts like an insulated ENPH proxy.
ICLN generally follows the S&P and the drops a less drastic. The recent 6% gap up was due to ENPH strong earnings (20% above estimates)
Overall it is generally a bullish sector and I think this has to do with the Oil and Gas conflict and volatility
Risk Mitigation
There is an uptrend S&R line and the Strike at 20 is at a position before their gap up. If we break this gap it would be a significant change in direction and time to exit
I expect some bearish movements that follows the broader market’s volatility but more muted
Imagine Yourself Taking The Other Side
It is not a bad decision to take the opposite direction, even with the same hypothesis. Just worried about the upward gaps since ENPH seems to be doing well
Look For New Information
Fed rate hikes are happening next week, this could be a game changer
How Do I Feel Now
I really like this trade, I need to find more like this
Trade Specs
Sold 300 PUTs @ 0.15
Strike 20
% to Strike: 13.09%
BP Used: 66K
Max Gain: 4500

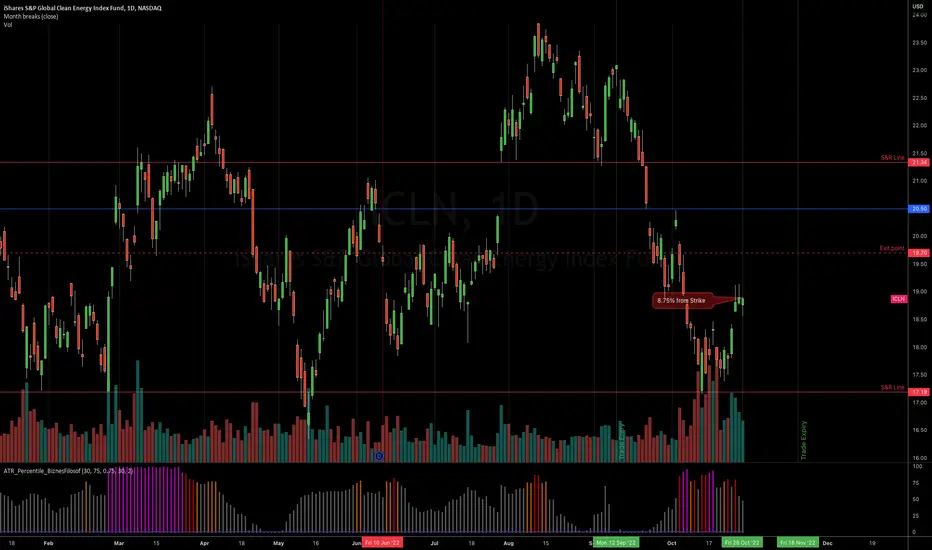
ICLN Bearish inclined naked calls 18 Nov expiry
Whats The Plan/Trade/Thought
ICLN is an ETF filled with companies that will rely heavily on bank loans to operate, this would probably result in accelerated dips with the increasing interest rates
Risk Mitigation
I see 19.70 as my indicator that my direction is wrong and I should exit
Can You Trade The Opposite Side (Y/N)
N
Trade Specs
Sold 260 Calls @ 0.15
Strike 20.5
8.75% to Strike
BP Used: 53k
Max Gain: 3900
ICLN - Global Clean Energy ETF - LongPrices are trading in a corrective formation ahead of an impulse upward 5th wave. The next move will drive the market higher to 25.20, 25.50 and 26.10. We would recommend building long positions at market with a take profit at 25.20/50.
A daily close below 20.00 would invalidate the upward scenario mentioned above.


Global Clean Energy READY TO TAKE OFF?!Energy dependent Nations looking for new sources of energy primarily clean Energy. The Bipartisan Infrastructure Law and the Energy Act of 2020 provides over $60 billion primarily for new major clean energy demonstration and deployment programs and more than triples DOE’s annual funding for energy programs, including significantly expanded research and development (R&D) and entirely new demonstration and deployment missions.

Clean Energy Index Fund - Good entry levelClean Energy sector shows a solid entry point.
Fib retracement and fib extension seem to have formed a bottom at the 17 level.
IMHO this is a good entry level, with SL below 17 and target above 40 offering an 8:1 ratio.
The macro outlook also support the bullish case.

2022 ICLN Renewable Energy Sector ETFHey the renewable energy sector has underperformed the market in 2021, will look for an entry of $15-16 area in 2022 for a big swing stay updated.

$icln - a healthy looking monthly chartlots panicked over the sell off since ATH.
Just sit back, relax. set it and forget it. this is not a stock to trade.

Long Term ICLN investment I believe that renewable energies are the inescapable final destination for all of humanity, as even the oil industry knows that fossil fuel deposits are finite. To me, the renewable energy revolution has always been a question to when not if. For example, over the past decade or so advancements in semiconductor processing and production methods has lead to a 500% decrease in the scalability cost of solar panels. At this link you can look at a plot of the cost per Kwh as a function of time:
rameznaam.com
The big deal here is simply that around 2019 solar panels crossed into a cost region where it is almost cheaper to create power per Kwh with solar vs fossil fuel. This critical threshold applies to other renewables like wind as well, which basically means we are at a turning point from a business perspective where clean energy production will simply be as or more profitable than fossil fuels.
People have been aware of this for years now, so this is nothing new and some clean energy funds are already doing very well. I didn't really have much interest in investing over the past decade though, so as I prepare college funds for the future I'm really looking for the best value play when buying into a clean energy fund. I think ICLN could offer a lot of value relative to other more pricey clean energy funds based on the speculation that it has a lot of growth potential.
From a technical standpoint, the fund appears to be in a correction phase following a big run-up after the COVID drop back in March 2020.There is a 1D and 2D support at $21 that could be the bottom of a consolidation wedge given that the price action seems to show the 3 bear flags indictive of a completed wave A correction and shows good bullish divergence on the 13May21 low let. The 1D resistance at 23.55 could be the critical breakout point for this consolidation wedge:
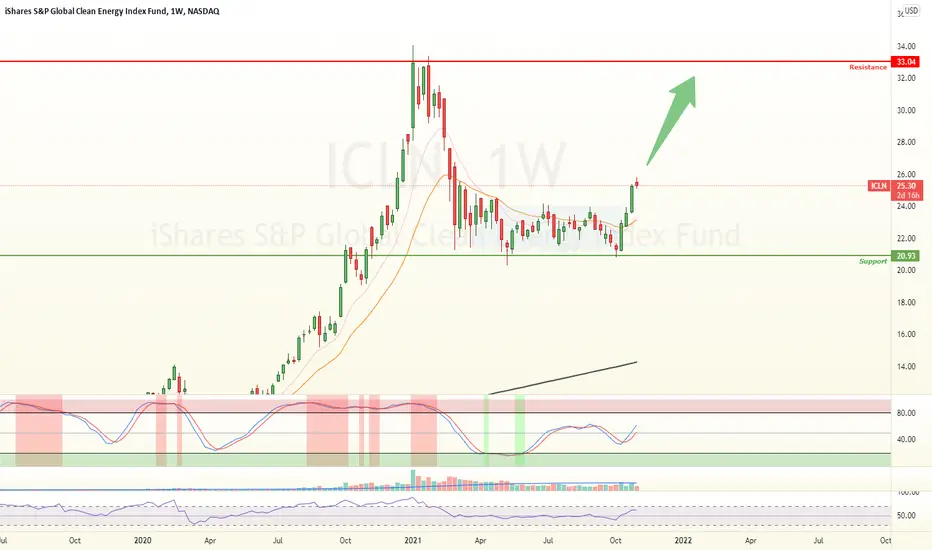
On the larger 1W timeframe the price action can also be interpreted as a large Cup and Handle pattern. This timeframe also shows the average volume has never been net negative and both the average volume and average volume derivative appear to have been in a sideways correction since around march of this year until now.
According to the Recognia Elliot wave detection algorithm, ICLN entered into wave 3 back in October of 2021 following the downward break from the 3rd bear flag (labeled with orange trend lines and the 3) and exceeded the 24.52 price target. In the period over this wave, the average volume shown in the middle bottom chart had a steady positive slope, hit an inflection point from net negative volume to net positive and had a strong positive sloped derivative (shown on the bottom most plot and implying the increasing average volume has a positive rate of change). Recognia does not offer analysis on super-cycle Elliot waves as these cycles are too dependent on macroeconomic forces, but given the dynamics of renewables worldwide I think ICLN could breakout form this consolidation as a continuation of a wave 3 super cycle.
My stop loss is set at 19.50 to allow for a little leeway at the critical $21 support, but also provide protection since there could be a lot more downside than anticipated. I will be DCAing into an increasing position size indefinitely with the goal of lowering my cost basis per share until a bottom has definitely been found or the stop loss is triggered.

11/21/21 ICLNiShares S&P Global Clean Energy Index Fund ( NASDAQ:ICLN )
Sector: Miscellaneous (Investment Trusts/Mutual Funds)
Current Price: $24.69
Breakout price trigger: $24.90
Buy Zone (Top/Bottom Range): $25.00-$23.80
Price Target: $25.70-$26.20 (1st), 27.35-$28.00 (2nd), $28.90-$30.00 (3rd)
Estimated Duration to Target: 10-12d (1st), 27-30d (2nd), 48-50d (3rd)
Contract of Interest: $ICLN 12/3/21 24.5c, $ICLN 12/17/21 25c, $ICLN 1/21/22 25c
Trade price as of publish date: $0.65/contract, $0.60/contract, $0.95/contract

Global Clean Energy ETF Analysis 04.11.2021Hello Traders,
welcome to this free and educational analysis.
I am going to explain where I think this asset is going to go over the next few days and weeks and where I would look for trading opportunities.
If you have any questions or suggestions which asset I should analyse tomorrow, please leave a comment below.
If you enjoyed this analysis, I would definitely appreciate it, if you smash that like button.
Thank you for watching and I will see you tomorrow!

$ICLN - S&P Global Clean Energy Fund- Price is breaking out of a period of consolidation on the ICLN ETF
- Looking for a move back towards the swing highs while we remaining above the support zone
-- MANAGE YOUR RISK - -
Disclaimer: All ideas are my opinion and should not be taken as financial advice.
ICLN - Clean Energy ETF - sector analysis, long setupICLN is setting up well on the monthly charts.
Points for consideration:
1. Price above 20 Day, 20 week and 5 month MA. This should act as a nice support zone
2. 200 Day Moving Average right above us that could act as potential resistance.
3. RSI is crucial zones and positive structure
4. Break above 200 Day MA will be seen as very bullish on daily/weekly close basis
Other ETFs in the same Clean Energy space are as below
1. PBW, TAN, CNRG, ACES, PBD,ICLN, QCLN, SMOG, FAN, NLR, GRID
2. Except NLR and GRID, all the others are below their 200 Day MA.
3. All the above ETFs have shown recent strength and above their 9 day and 20 Day MAs
From a sector ETF Relative Ranking Perspective, these are my current Rankings on relative strength basis (as on 15th Oct 2021 business close basis) and this is dynamic with price changes
ETF Name Ticker Strength Score Rank
iShares Global Clean Energy ETF ICLN 60.00% 5
Invesco WilderHill Clean Energy ETF PBW 20.00% 8
Invesco Solar ETF TAN 100.00% 1
SPDR S&P Kensho Clean Power ETF CNRG 90.00% 2
ALPS Clean Energy ETF ACES 80.00% 3
Invesco Global Clean Energy ETF PBD 30.00% 7
First Trust NQClean Edge Green Energy Idx Fd ETF QCLN 70.00% 4
VanEck Low Carbon Energy ETF SMOG 40.00% 6
First Trust NQ Clean Edge Smart Grid Infra Idx ETF GRID 10.00% 10
First Trust Global Wind Energy ETF FAN 20.00% 8
Will be preparing my views on the top 5 ETFs in this space based on the above relative strengths and will link them for your views and observations
Stocks to look for currently in this sector are as follows
1. RUN
2. JKS
3. PLUG
4. BWEN
5. SEDG
6. ENPH
7.TPIC
8. FSLR
9. FCEL
10. EVA
11. REX
12. AY
13. ORA
14. TPIC
15. EVA
16. CVA
AQN is currently showing a potential for downward break below its 52 week low, while TPIC, EVA and CVA are very close to their 52 week high
Interesting sector, has been all around the place so far.


ICLN - Long term looks goodICLN - Long term looks good.
Short term it might chop for longer. It has a little room to go down more if we look at 1-6month range.
Scaled out 5Y looks like a nice setup though.

Symmetrical Triangle - BullishPersonally am quite bullish on the ICLN as well as many of its holdings. Closed on Friday sitting right on its 200-day EMA which it has previously bounced off of many times and is approaching the end of a massive symmetrical triangle. Bollinger bands are squeezing as well (not pictured), undoubtedly a long-term play but will be keeping a close eye on this one. Just some support and resistance levels and some RSI based supply and demand zones to keep an eye on as well- bullish


$ICLN Elliott Wave AnalysisI think I currently in a smaller two wave within the larger cycle. In the short term I can see a grind up to 25+ for the B wave before it ultimately heads lower to 18ish ( at the golden fibonacci zone) . From there I can see a huge move in the 3rd wave to ultimately 50+. NOT FINANCIAL ADVICE. If anyone has questions please ask , and if you want me to look at something dont be afraid to ask, good luck to all.
