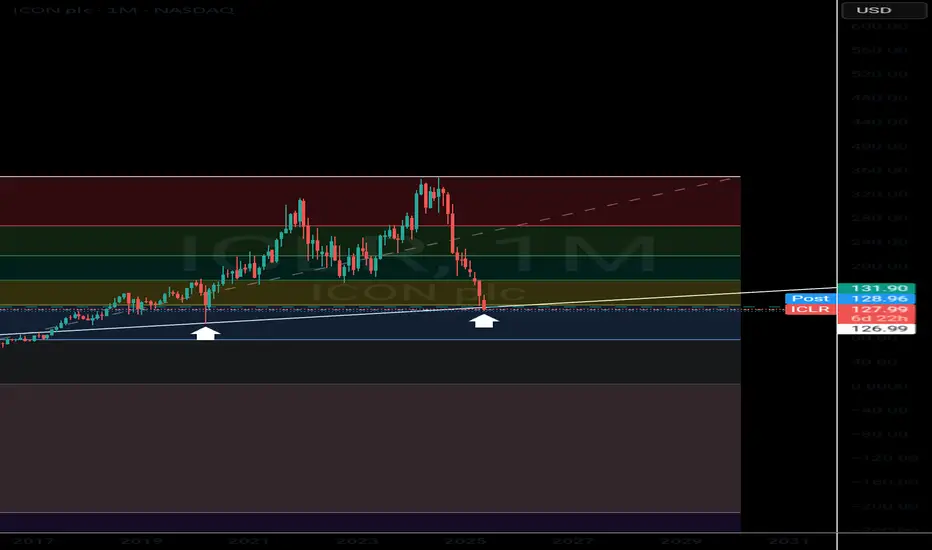
What buying opportunity! $ICLRNASDAQ:ICLR
Calling all long term investors.
This is a mega long term buying opportunity.
- 9 consecutive months of selling
- Mega 2008, 2020 support trend line
- Huge FIBONACCI retrace of entire stock market trading history
- Oversold technical chart
- positive divergence on daily/ weekly time frames
If you tuvk this away for 3-5 years you'll likely be very happy.
ICLR trade ideas
ICLR: Second Attempt at Strong Support with 1/20 Risk/RewardNASDAQ:ICLR has been in a historical bullish trend 📈 and is now positioned at a strong support zone, offering a potential buying opportunity. This is my second attempt after the first stop was triggered. Over the past few months, volume has been increasing, signaling growing accumulation and renewed buying interest. With the all-time high (ATH) not far away 🎯 and a highly favorable 1/20 risk/reward ratio, this setup presents a promising opportunity for a bullish move toward new highs. 🚀.

ICLR: Bullish Setup at Strong Support with 1/10 Risk/RewardNASDAQ:ICLR has been in a historical bullish trend 📈 and is currently positioned at a strong support zone , offering a potential buying opportunity. There’s a potential local double bottom formation , and the last candle is a bullish engulfing pattern 🔥, signaling a possible upward reversal. Over the past few months, volume has increased , indicating growing accumulation. With the all-time high ( ATH ) not far away 🎯, the risk/reward ratio to ATH stands at a favorable 1/10 . This setup presents a promising opportunity for a bullish move toward new highs. 🚀

3D Printed Homes, LA FIRESI’m unsure whether this is the ideal time to buy or simply begin accumulating, but the company, which 3D prints custom fire-resistant concrete single-family homes, may finally have the opportunity it needs in Los Angeles. Local news has covered the mayor and ICON executives participating in photo ops and check giveaways to families displaced by recent fires. While the future remains uncertain, $200 seems like a reasonable round number (though if you can acquire the stock for less, even better). While I typically favor Elliott strategies, construction and LA politics are my primary focus during the day. Please note, this is not financial advice, and I recommend using a stop-loss strategy

$ICLR with a Bullish outlook following its earnings #Stocks The PEAD projected a Bullish outlook for $ICLR after a Positive Under reaction following its earnings release placing the stock in drift A with an expected accuracy of 93.33%.

$ICLR: Don't Be a Stickler for an $ICLR$ICLR may represent a buying opportunity on this pullback. Health care, specifically large cap health care like this one tend to do well in deflationary environments and with the Fed signaling 3 rate hikes in 2022 it may be an opportune time to get positioned.

ICLR DailyNASDAQ:ICLR looks ready to continue the uptrend after a nice rounded bottom and the 5 EMA crossing back above the 20 EMA.


ICON Stock- Possible Long PositionMomentum trade- use trailing SL- could start with SL at 200EMA point.
Peace & Love


P/E Resistance Tipping Point, possibly?Recently had a positive breakout due to earnings from a resistance line set a year ago after earning on 7/28, free cash flow has been improving since that time and the current CMF is positive on the weekly and daily chart. Recent earnings broke the prior resistance but have pulled back. Buying on the pullback with the expectation of support having been confirmed on the daily charts. P/E has been dropping from a high of 72 in 2012 to the current 17.37 in 2016. On the cusp of breaking the PE resistance as well and may continue to move higher. Currently speculation is that the price has meet the P/E resistance line from 2012 at the current price, has been consolidating around 76 a prior and current resistance level. If it Breaks the 2012 P/E resistance it would meet another P/E resistance level at 20-19 which is an improvement from the current 17.37. It has touched the 20day moving average in the Bollinger Bands post breakout of the upper band, and may bounce positively off of it. Would enter a short position if I could, if the long conjecture is false.


ICLR break up on earningsICLR on a long uptrend
price consolidate at 50$ and created inverse H&S
broke neckline today on good earnings result
nice upside potential here but big stop loss
*for conservative traders - look for a closing gap down move and support at gap/neckline
GL
