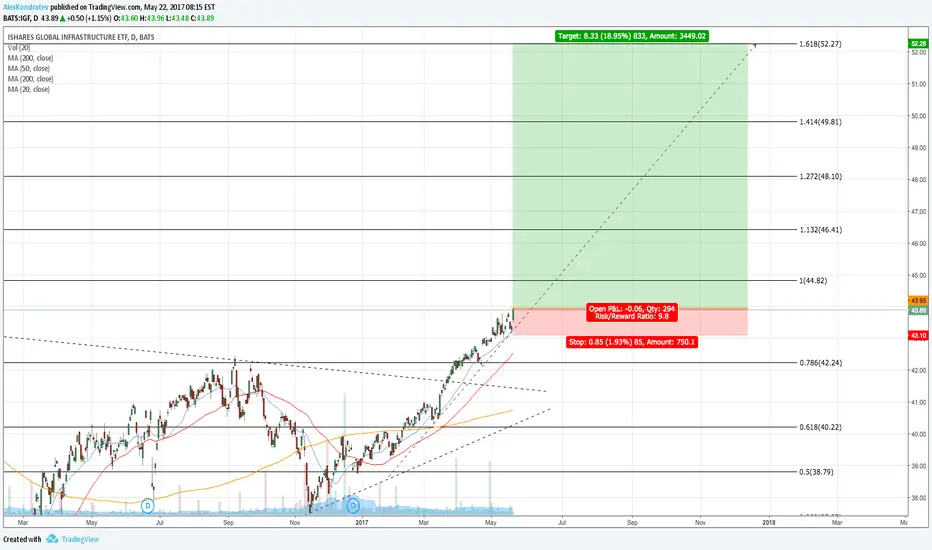
Infrastructure surgingUS Infrastrucutre AMEX:IFRA has been leading the global industry NASDAQ:IGF since it peaked in April of 2022
But, since this august global diversification has been outperforming american companies
Sometimes is good to look outside the US market
Key stats
About iShares Global Infrastructure ETF
Home page
Inception date
Dec 10, 2007
Structure
Open-Ended Fund
Replication method
Physical
Dividend treatment
Distributes
Distribution tax treatment
Qualified dividends
Income tax type
Capital Gains
Max ST capital gains rate
39.60%
Max LT capital gains rate
20.00%
Primary advisor
BlackRock Fund Advisors
Distributor
BlackRock Investments LLC
IGF is one of the oldest funds in the global infrastructure segment. With a broad definition of infrastructure firms, it offers a reasonable take on the segment as it holds diversified positions across three sectors: energy, transportation, and utilities. After categorizing eligible securities into three sectors, the fund selects the largest stocks according to market cap, having 15 stocks from the emerging markets with no more than 10 for any single sector and 60 stocks from the developed markets. Overall, IGF holds a concentrated portfolio of 75 global infrastructure companies, subject to count and weight constraints such that the transportation and utilities sector each consists of 30 securities having 40% weight and the energy sector contains 15 securities taking 20% weight of the portfolio. Stocks are cap-weighted within each sector, with no individual security having a weight greater than 5%. The index rebalancing occurs on a semi-annual basis.
Related funds
Classification
What's in the fund
Exposure type
Utilities
Transportation
Industrial Services
Stock breakdown by region
Top 10 holdings


Summarizing what the indicators are suggesting.
Oscillators
Neutral
SellBuy
Strong sellStrong buy
Strong sellSellNeutralBuyStrong buy
Oscillators
Neutral
SellBuy
Strong sellStrong buy
Strong sellSellNeutralBuyStrong buy
Summary
Neutral
SellBuy
Strong sellStrong buy
Strong sellSellNeutralBuyStrong buy
Summary
Neutral
SellBuy
Strong sellStrong buy
Strong sellSellNeutralBuyStrong buy
Summary
Neutral
SellBuy
Strong sellStrong buy
Strong sellSellNeutralBuyStrong buy
Moving Averages
Neutral
SellBuy
Strong sellStrong buy
Strong sellSellNeutralBuyStrong buy
Moving Averages
Neutral
SellBuy
Strong sellStrong buy
Strong sellSellNeutralBuyStrong buy
Displays a symbol's price movements over previous years to identify recurring trends.
Frequently Asked Questions
An exchange-traded fund (ETF) is a collection of assets (stocks, bonds, commodities, etc.) that track an underlying index and can be bought on an exchange like individual stocks.
IGF trades at 59.20 USD today, its price has risen 0.20% in the past 24 hours. Track more dynamics on IGF price chart.
IGF net asset value is 59.21 today — it's risen 0.17% over the past month. NAV represents the total value of the fund's assets less liabilities and serves as a gauge of the fund's performance.
IGF assets under management is 7.66 B USD. AUM is an important metric as it reflects the fund's size and can serve as a gauge of how successful the fund is in attracting investors, which, in its turn, can influence decision-making.
IGF price has risen by 0.29% over the last month, and its yearly performance shows a 18.59% increase. See more dynamics on IGF price chart.
NAV returns, another gauge of an ETF dynamics, have risen by 0.17% over the last month, showed a 5.50% increase in three-month performance and has increased by 21.95% in a year.
NAV returns, another gauge of an ETF dynamics, have risen by 0.17% over the last month, showed a 5.50% increase in three-month performance and has increased by 21.95% in a year.
IGF fund flows account for 3.08 B USD (1 year). Many traders use this metric to get insight into investors' sentiment and evaluate whether it's time to buy or sell the fund.
Since ETFs work like an individual stock, they can be bought and sold on exchanges (e.g. NASDAQ, NYSE, EURONEXT). As it happens with stocks, you need to select a brokerage to access trading. Explore our list of available brokers to find the one to help execute your strategies. Don't forget to do your research before getting to trading. Explore ETFs metrics in our ETF screener to find a reliable opportunity.
IGF invests in stocks. See more details in our Analysis section.
IGF expense ratio is 0.39%. It's an important metric for helping traders understand the fund's operating costs relative to assets and how expensive it would be to hold the fund.
No, IGF isn't leveraged, meaning it doesn't use borrowings or financial derivatives to magnify the performance of the underlying assets or index it follows.
In some ways, ETFs are safe investments, but in a broader sense, they're not safer than any other asset, so it's crucial to analyze a fund before investing. But if your research gives a vague answer, you can always refer to technical analysis.
Today, IGF technical analysis shows the buy rating and its 1-week rating is buy. Since market conditions are prone to changes, it's worth looking a bit further into the future — according to the 1-month rating IGF shows the buy signal. See more of IGF technicals for a more comprehensive analysis.
Today, IGF technical analysis shows the buy rating and its 1-week rating is buy. Since market conditions are prone to changes, it's worth looking a bit further into the future — according to the 1-month rating IGF shows the buy signal. See more of IGF technicals for a more comprehensive analysis.
Yes, IGF pays dividends to its holders with the dividend yield of 2.02%.
IGF trades at a premium (0.02%).
Premium/discount to NAV expresses the difference between the ETF’s price and its NAV value. A positive percentage indicates a premium, meaning the ETF trades at a higher price than the calculated NAV. Conversely, a negative percentage indicates a discount, suggesting the ETF trades at a lower price than NAV.
Premium/discount to NAV expresses the difference between the ETF’s price and its NAV value. A positive percentage indicates a premium, meaning the ETF trades at a higher price than the calculated NAV. Conversely, a negative percentage indicates a discount, suggesting the ETF trades at a lower price than NAV.
IGF shares are issued by BlackRock, Inc.
IGF follows the S&P Global Infrastructure Index. ETFs usually track some benchmark seeking to replicate its performance and guide asset selection and objectives.
The fund started trading on Dec 10, 2007.
The fund's management style is passive, meaning it's aiming to replicate the performance of the underlying index by holding assets in the same proportions as the index. The goal is to match the index's returns.