India 50 Major Market Caution Signs Emerging!Any time you see multiple head-and-shoulders patterns forming on the chart often signals serious trouble ahead.
Stay vigilant for a break in the right shoulder of this massive head-and-shoulders pattern currently developing.
As a macro trader, I focus on the big picture—economics and long-term tre
Key stats
About iShares India 50 ETF
Home page
Inception date
Nov 18, 2009
Structure
Open-Ended Fund
Replication method
Physical
Dividend treatment
Distributes
Distribution tax treatment
Qualified dividends
Income tax type
Capital Gains
Max ST capital gains rate
39.60%
Max LT capital gains rate
20.00%
Primary advisor
BlackRock Fund Advisors
Distributor
BlackRock Investments LLC
INDY captures large-cap Indian equities by tracking the Nifty 50 Index, an index that holds a concentrated portfolio of 50 blue-chip companies traded on India's National Stock Exchange. This covers approximately 66% of the Indian companies by market capitalization. The index uses market-cap and liquidity screens in identifying its constituents. Selected securities are then weighted by market-cap and reconstituted on a semi-annual basis. Overall, INDY offers a decent, plain-vanilla take on Indian large-cap stocks.
Related funds
Classification
What's in the fund
Exposure type
Finance
Technology Services
Stock breakdown by region
Top 10 holdings

$INDY: Update - Buy signal in monthly scale here...🚨🚨🚨
If you are not exposed to India, now is a good time to join.
📢
Train is leaving the station here, monthly suggests immediate upside in the order of 8-10% in the coming quarter, which will likely trigger a breakout away from the long term consolidation here, to trace my expected path long ter

India is the long term winner of de-globalizationIndia is the winner for the next decade ahead, and with its manufacturing expansion, energy.
Fossil fuels, coal in particular, are set to benefit long term as India absorbs a chunk of China’s manufacturing footprint.
The reshoring / nearshoring / friendshoring theme, can reverse some of the impact

India INDY ETF bounced off supportAn interesting observation here...
The weekly chart for INDY has recent bullish candlestick patterns after bouncing off a long term support level at 41.50. This is the second test in 2022, and the bounce closed above the next (gap) resistance level, above 43. The technical indicators are turning b

$INDY New All Time Highs. Weekly Chart1) Price is above the 13 sma for week and month
2) AO is positive for week and month
3) Elder Impulse is green for week and month


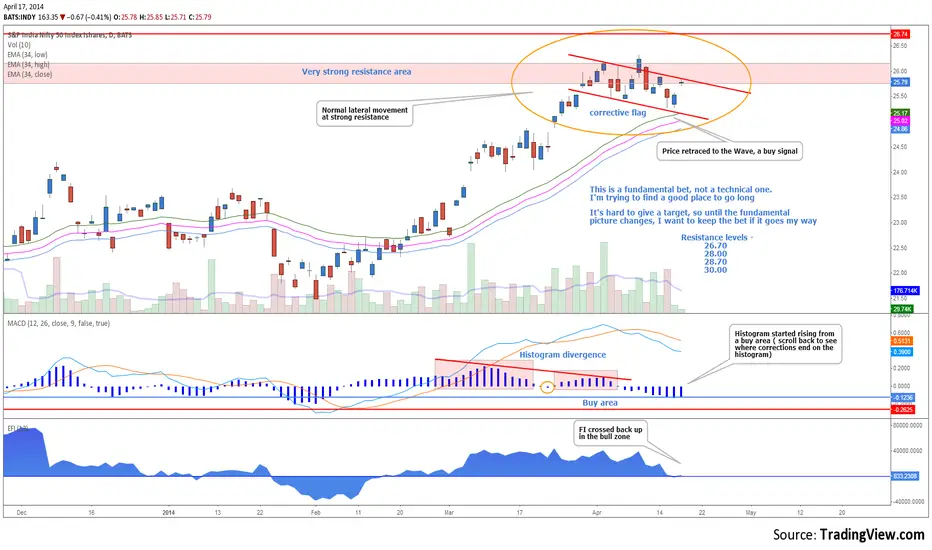
India - Long on fundamentalsI can't tell you why exactly why India is a buy, as I do not know much about macroeconomics. The main ideea is that elections are coming and investors are confident this will change India's economy. This is an ideea coming from the macro analyst I follow, and he is yelling Buy Buy Buy since February

See all ideas
Summarizing what the indicators are suggesting.
Oscillators
Neutral
SellBuy
Strong sellStrong buy
Strong sellSellNeutralBuyStrong buy
Oscillators
Neutral
SellBuy
Strong sellStrong buy
Strong sellSellNeutralBuyStrong buy
Summary
Neutral
SellBuy
Strong sellStrong buy
Strong sellSellNeutralBuyStrong buy
Summary
Neutral
SellBuy
Strong sellStrong buy
Strong sellSellNeutralBuyStrong buy
Summary
Neutral
SellBuy
Strong sellStrong buy
Strong sellSellNeutralBuyStrong buy
Moving Averages
Neutral
SellBuy
Strong sellStrong buy
Strong sellSellNeutralBuyStrong buy
Moving Averages
Neutral
SellBuy
Strong sellStrong buy
Strong sellSellNeutralBuyStrong buy
Displays a symbol's price movements over previous years to identify recurring trends.
Frequently Asked Questions
An exchange-traded fund (ETF) is a collection of assets (stocks, bonds, commodities, etc.) that track an underlying index and can be bought on an exchange like individual stocks.
INDY trades at 52.28 USD today, its price has fallen −0.91% in the past 24 hours. Track more dynamics on INDY price chart.
INDY net asset value is 52.25 today — it's fallen 4.47% over the past month. NAV represents the total value of the fund's assets less liabilities and serves as a gauge of the fund's performance.
INDY assets under management is 698.70 M USD. AUM is an important metric as it reflects the fund's size and can serve as a gauge of how successful the fund is in attracting investors, which, in its turn, can influence decision-making.
INDY price has fallen by −4.71% over the last month, and its yearly performance shows a −4.12% decrease. See more dynamics on INDY price chart.
NAV returns, another gauge of an ETF dynamics, have fallen by −4.47% over the last month, showed a −0.92% decrease in three-month performance and has decreased by −4.40% in a year.
NAV returns, another gauge of an ETF dynamics, have fallen by −4.47% over the last month, showed a −0.92% decrease in three-month performance and has decreased by −4.40% in a year.
INDY fund flows account for −206.94 M USD (1 year). Many traders use this metric to get insight into investors' sentiment and evaluate whether it's time to buy or sell the fund.
Since ETFs work like an individual stock, they can be bought and sold on exchanges (e.g. NASDAQ, NYSE, EURONEXT). As it happens with stocks, you need to select a brokerage to access trading. Explore our list of available brokers to find the one to help execute your strategies. Don't forget to do your research before getting to trading. Explore ETFs metrics in our ETF screener to find a reliable opportunity.
INDY invests in stocks. See more details in our Analysis section.
INDY expense ratio is 0.65%. It's an important metric for helping traders understand the fund's operating costs relative to assets and how expensive it would be to hold the fund.
No, INDY isn't leveraged, meaning it doesn't use borrowings or financial derivatives to magnify the performance of the underlying assets or index it follows.
In some ways, ETFs are safe investments, but in a broader sense, they're not safer than any other asset, so it's crucial to analyze a fund before investing. But if your research gives a vague answer, you can always refer to technical analysis.
Today, INDY technical analysis shows the sell rating and its 1-week rating is neutral. Since market conditions are prone to changes, it's worth looking a bit further into the future — according to the 1-month rating INDY shows the buy signal. See more of INDY technicals for a more comprehensive analysis.
Today, INDY technical analysis shows the sell rating and its 1-week rating is neutral. Since market conditions are prone to changes, it's worth looking a bit further into the future — according to the 1-month rating INDY shows the buy signal. See more of INDY technicals for a more comprehensive analysis.
Yes, INDY pays dividends to its holders with the dividend yield of 0.00%.
INDY trades at a premium (0.19%).
Premium/discount to NAV expresses the difference between the ETF’s price and its NAV value. A positive percentage indicates a premium, meaning the ETF trades at a higher price than the calculated NAV. Conversely, a negative percentage indicates a discount, suggesting the ETF trades at a lower price than NAV.
Premium/discount to NAV expresses the difference between the ETF’s price and its NAV value. A positive percentage indicates a premium, meaning the ETF trades at a higher price than the calculated NAV. Conversely, a negative percentage indicates a discount, suggesting the ETF trades at a lower price than NAV.
INDY shares are issued by BlackRock, Inc.
INDY follows the Nifty 50. ETFs usually track some benchmark seeking to replicate its performance and guide asset selection and objectives.
The fund started trading on Nov 18, 2009.
The fund's management style is passive, meaning it's aiming to replicate the performance of the underlying index by holding assets in the same proportions as the index. The goal is to match the index's returns.