Could breakout and continue momentumCould breakout and continue momentum. It's above fib but below last high.
Also on Yahoo Finance's most shorted screener.
Friend entered at 126 with knockout option TT5P2Y. I bought the stock cash due to tax laws.
IRBT trade ideas

$IRBT weekly inside bar $IRBT made a big mover adn it pulled back in is getting very tight, eyign 155-160 calls layered april may w an add over 130 level


BUY $IRBT - 02.22.2021Stockonomy Weekly Pick 02.22.2021
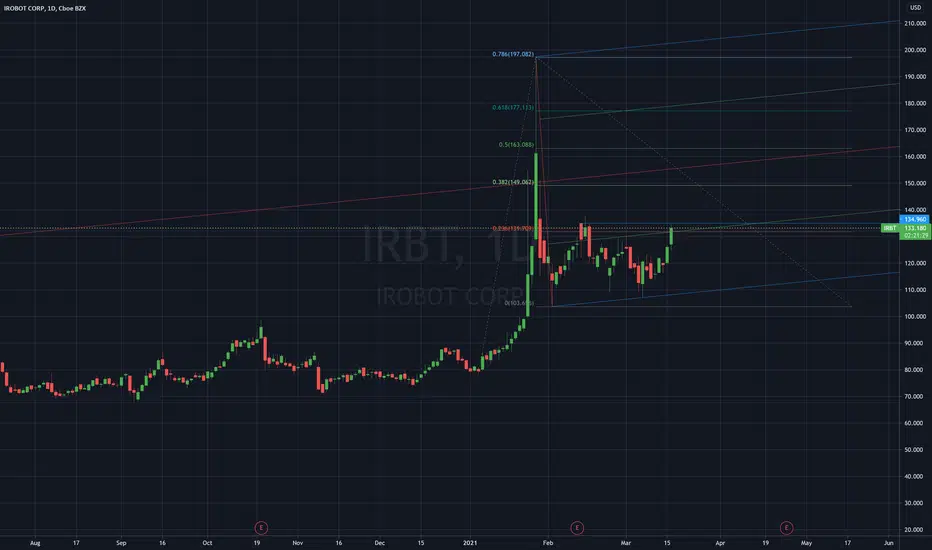
$IRBT saw price run-up as high as $197 a few weeks ago on strong volume.
Price has since consolidated and restarted it's uptrend.
Buying this first dip could be a good entry.

IRBTRobot company which engages in designing and building robots
Perfect for a new long set-up
NASDAQ:IRBT

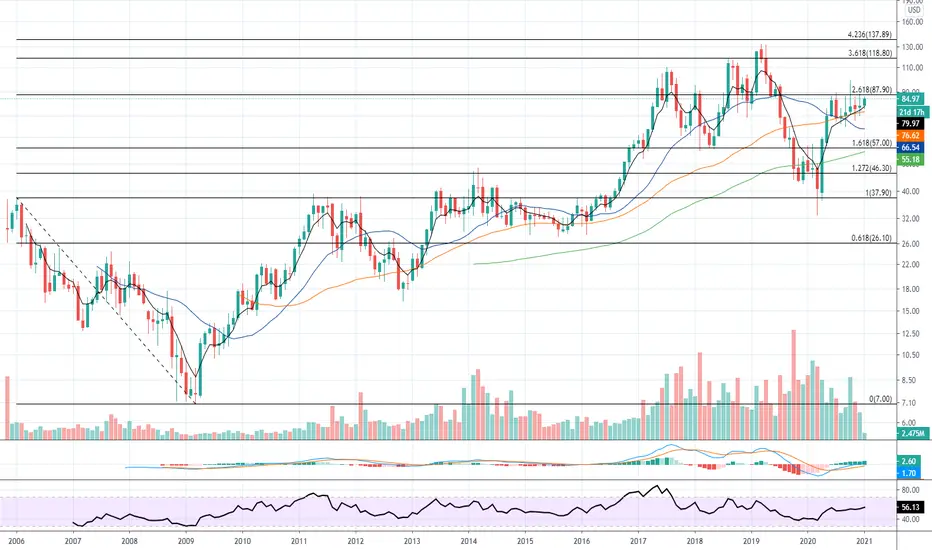
IRBT - Month chart study continuation from my first post todayWe had our last cup and handle on the month chart and the continuation of the rise was stopped by COVID. Now we are in our second cup and handle. This handle is huge. I believe that this stock can finally see new ground....unless robot vacuums are unfriendly to the environment...haha :) We are going to continue up for a bit but watch for a pullback.

IRBT - Wow the month chart - scary but hides a secretSo I love the company "IROBOT" symbol IRBT. They have incredible Revenues and Profits. They have the coolest toys to clean your home and more. On this post with so many earnings they have only missed -----7----- times. Holly crap why does the chart look like a damn roller coaster at Six Flags then? Most all of those misses were not in the past 10 years. For one thing in this month chart as they were recovering from the last drop they were beat down by the covid slaughter and have recovered nicely. I think to myself are we at the top and are we going to see another dip in 2-4 months. By the month chart it damn sure looks that way....? Well if you take out the covid drop it does not look so bad. They have had a gradual rise over the years and currently have a low p/e ratio of 25. This is great!! They should be much higher than where they are because of their profitability and positive outlook.
My thought is that this stock it not reaching the top, but that it is just starting off and has been under the radar for a long time. I am Long, but cautious.


$IRBTEntry price : 112.92
Fundamentals :
- Sector: Consumer - Household appliances
- EPS % Chg (Last Qtr): 164%
- EPS % Chg (Previous Qtr): 728%
- 3 Year EPS Growth Rate: 20%
- EPS Est % Chg (Current Yr): 0%
- Sales % Chg (Last Qtr): 43%
- Sales % Chg (Previous Qtr): 8%
- 3-Year Sales Growth Rate: 15%
- Annual Pre -Tax Margin: 10.6%

IRBT - Consolidation BreakLower volume, consolidation break to fib .382 at 145 levels. By the rumor, sell the news.

iRobot ShortingiRobot
Volume: down with more than 70%
RSI: Divergence
Short Float: Around 40%
Repetition of the cycles in 3 years: 10 to 13
Short Zone 1: Probability 65%
Short Zone 2: Probability 75%
(do your home work)

IRBTJust a massive move yesterday along with many other stocks. I sold out for now, will wait for it to set back up.


$IRBT IROBOT CORP Earnings Runup
Please see chart for details of the potential trade and targets.
Thank you for taking the time to check it out
and if you have time please drop a like or comment. Happy trading.

IROBOT CORP OpportunityHey tradingviews community, IROBOT CORP is in a bullish composition with low past purchase volume and a kind of hammer candle. The TIMEFRAME M1 shows a marubozu with a low buy traded it goes on the base of the bollinger to test it. Then go to its highest in order to go to the top of the range to test it again. It is very plausible to breakout the price at the same time with the momentum ranges it to reach in the next and to reach the high which follows (See the TIMEFRAME H4). Before filling a bearish breakout gap then (the TIMEFRAME H1) before the adjustment (of the TIMEFRAME H1) with the next high point on breakout after a range. No craze at the sight of carriers to test half of the middle median of the ANDREWS PITCHFORK range.
Please LIKE & FOLLOW, thank you!

$IRBT ROBOTS ARE YOUR FRIENDincredible margins and revenue growth. EPS growth is excellent. 7 month price consolidation after breaking a downtrend. breaking out of previous resistance and moving above the 10wma on increasing volume. target price $145.

Trend breakout in IROBOT (IRBT) Breakout in IROBOT (IRBT) RSI at 60 and break in the trend line , only issue is volume is low today. Can wait how it behaves tomorrow. Resistance $88.26 ,$92 ,$98 and support $83.69 for stop loss at $83.50. Revenue: $1.3 billion Market Cap: $2.23 billion , I feel stock is undervalued.

IRBTNice move today. Some may call this a head & shoulders. I call it a head & shoulders that is going to fail, miserably. Hoping this is not the move to light the fire, because the closer it gets to $71, the heavier my bag will get. Watching for now.

IRBTMight be one of my favorite setups right now. I was long this name going into 2020 with leaps but got stopped out due to Covid. Setting up again very nicely. 5 monthly doji candles in a row looking to break higher. Looks good on all time frames. Daily next.


$IRBT - watching for entryIt has closed above the 50 SMMA
MACD, ATR, stochastic are all in supportive positions.
It's under resistance and the volume just isn't there quite yet. Once it breaks, hop in for a short ride.
