IRDM: Make or Break It Hey everyone,
This is more of a fundamental idea on one of my favourite companies, IRDM, though there is math and analysis involved.
Here are key points that I didn't want to elaborate on in the idea, but just for background info.
Summary of Earnings Transcript from Q1:
Iridium Communications reported solid performance with 6% growth in operational EBITDA and continued service revenue growth across key areas, including IoT, PNT, and engineering. CEO Matt Desch addressed uncertainties stemming from new U.S. tariffs, which could add up to $7 million in annual costs if fully implemented, though Iridium has mitigation strategies in place. Despite global trade volatility and increased competition from entrants like Starlink, Iridium remains confident in its differentiated offerings—particularly its L-band network, global coverage, and mission-critical capabilities. The company highlighted momentum in its next-gen IoT and Direct-to-Device (NTN Direct) services, GPS-alternative PNT solutions (boosted by its Satelles acquisition), and government partnerships. CFO Vince O’Neill confirmed full-year guidance for 5–7% service revenue growth and $490–500 million in operational EBITDA, citing robust free cash flow generation, healthy liquidity, and strong shareholder returns via dividends and buybacks. Management reiterated long-term confidence in Iridium’s growth strategy through 2030, supported by its technological edge and diverse partner ecosystem.
History of Irdium
1987: The concept for Iridium was born at Motorola’s Strategic Electronics Division in Arizona.
1990: Motorola publicly announced the Iridium project at simultaneous press conferences in New York, Beijing, London, and Melbourne
1991: Iridium Inc. was incorporated to develop and deploy the satellite network.
1997: The first Iridium satellites were launched from Vandenberg Air Force Base, beginning the build-out of the constellation.
November 1, 1998: Iridium officially launched its commercial satellite communications service. The first call was made by U.S. Vice President Al Gore to Gilbert Grosvenor, great-grandson of Alexander Graham Bell.
Iridium has had a slew of hardship, having filed for bankruptcy in 1999 and being revised in 2001.
IRDM's major competitors are Inmarsat, Globalstar ( BOATS:GSAT ) to a lesser extend as their network is not as broad, Telesat and Visat.
Starlink is not a direct competitor for Iridium as they server different purposes, but Iridium already faces strong competition with the above mentioned companies, in addition to the evolving companies such as NASDAQ:ASTS and NASDAQ:RKLB which have the ability to completely derail Irdium if they advance faster than Iridium can keep up.
These are my thoughts, hope you enjoyed!
Safe trades!
IRDM trade ideas

4/14/25 - $irdm - Not a LT winner4/14/25 :: VROCKSTAR :: NASDAQ:IRDM
Not a LT winner
- looking across the space names today
- i think NASDAQ:ASTS remains the most interesting (and would benefit/ ironically from a space X IPO, mainly bc of multiple)
- but financial engineering, e.g. a dividend... solid CF generation is fine for a soda brand, but not for satellite comms.
- i could be wrong about this, but LSD growth and in a hyper competitive industry w/ many better co's w improved tech is just not a fight i want to fight.
- gl to the longs, but this one isn't for me
V

Iridium communications……. $29.25 Looks like it’s breaking up Just bought an initial holding here.
I Like this one, satalite coms……. Check it out on the newswires
The company are initiating a large buyback of their shares.
Apologies for brief review……. So little time, so much to do

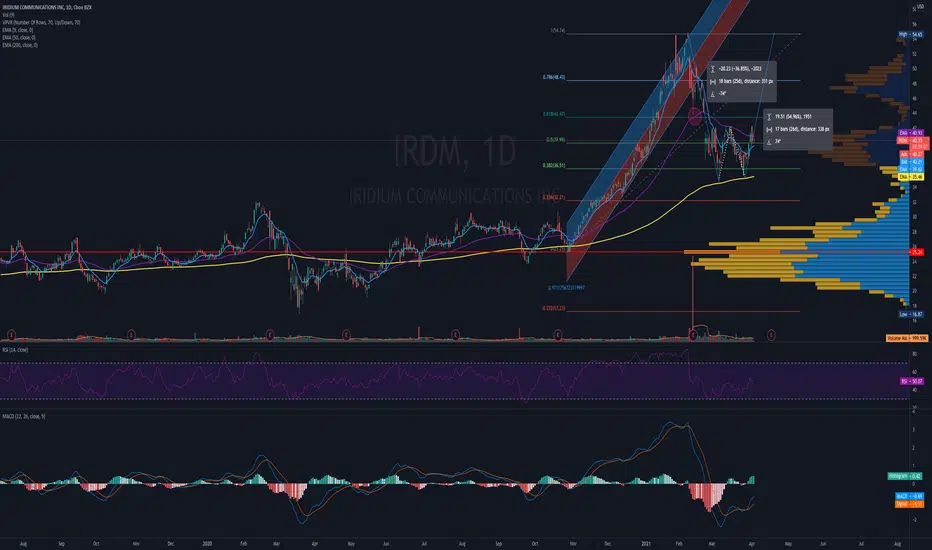
IRIDIUM Stock Chart Fibonacci Analysis 021824Trading Idea
1) Find a FIBO slingshot
2) Check FIBO 61.80% level
3) Entry Point > 30/61.80%
Chart time frame : C
A) 15 min(1W-3M)
B) 1 hr(3M-6M)
C) 4 hr(6M-1year)
D) 1 day(1-3years)
Stock progress : C
A) Keep rising over 61.80% resistance
B) 61.80% resistance
C) Hit the bottom
D) Hit the top
Stocks rise as they rise from support and fall from resistance. Our goal is to find a low support point and enter. It can be referred to as buying at the pullback point. The pullback point can be found with a Fibonacci extension of 61.80%. This is a step to find entry level. 1) Find a triangle (Fibonacci Speed Fan Line) that connects the high (resistance) and low (support) points of the stock in progress, where it is continuously expressed as a Slingshot, 2) and create a Fibonacci extension level for the first rising wave from the start point of slingshot pattern.
When the current price goes over 61.80% level , that can be a good entry point, especially if the SMA 100 and 200 curves are gathered together at 61.80%, it is a very good entry point.
As a great help, tradingview provide these Fibonacci speed fan lines and extension levels with ease. So if you use the Fibonacci fan line, the extension level, and the SMA 100/200 curve well, you can find an entry point for the stock market. At least you have to enter at this low point to avoid trading failure, and if you are skilled at entering this low point, with fibonacci6180 technique, your reading skill to chart will be greatly improved.
If you want to do day trading, please set the time frame to 5 minutes or 15 minutes, and you will see many of the low point of rising stocks.
If want to prefer long term range trading, you can set the time frame to 1 hr or 1 day.

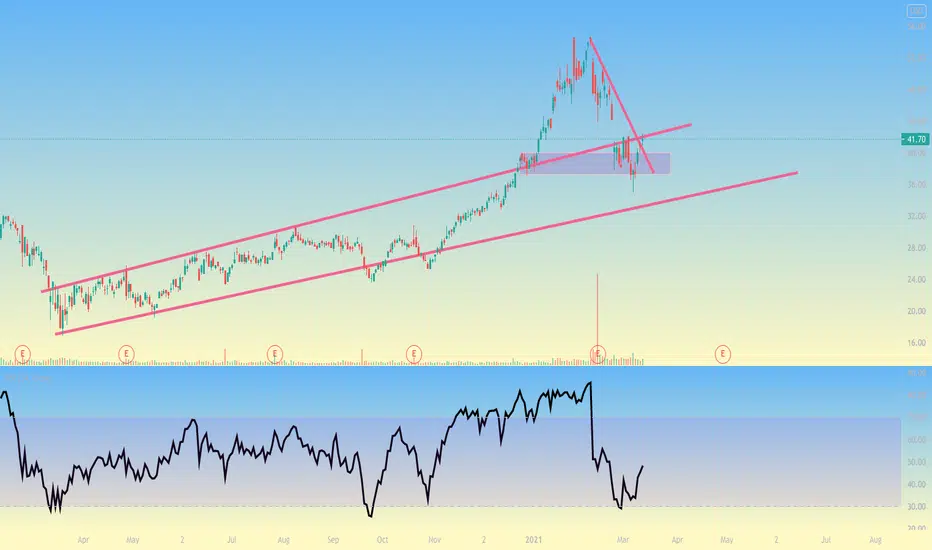
IRDM - Iridium Communications Inc - looking for longDear traders,
Id like to share this idea in order to take long positions,
30- 33$ is is a good price range to look for buying opportunities.
Additionally RSI is clearly oversold and prices already went down quite aggressive.
best,

IRDM monthly continuation?IRDM looks very interesting, we lost structure on the weekly chart by invalidating the last HL of up move.(which was a Bull flag breakout continuation up. All of this can still be a big continuations on the montly chart. For sure looks downwards for a bit before we can possibly get the monthly Higher Low.
i'd be careful buying below trendline for investments.
-D

IRDM to go down againIRDM has lost a major support level. Huge price drops thrice in last one month. It will try to go up to 50 before falling again.

July Trades (IRDM, account up 1.79%)12th day trade in July is NASDAQ:IRDM on 7/27/2023.
Account is up 1.79%.
Total return in July is 16.37%.

IRDM : POSITION TRADEIridium Communications: A Great Company At A Fair Price
NASDAQ:IRDM
- Iridium Communications has done really well in recent months between landing another large contract and increasing financial guidance.
- This has sent shares roaring higher, but this has a downside to it as well.
- The stock seems to be more or less fairly valued at this time, even though the firm remains excellent for long-term investors seeking stability.
...As revenue has risen, profitability has also increased. Net income of $4.6 million in the latest quarter was higher than the $3.8 million reported the same time one year earlier. Operating cash flow in the latest quarter came in at $99.8 million. That's 32.7% above the $75.2 million generated just one year earlier. Meanwhile, EBITDA for the company expanded from $94.8 million in the second quarter of 2021 to $105.9 million the same time this year. Naturally, this strong bottom line performance has had a positive impact on the company's results for the first half of the year as a whole.
Due to how things are turning out so far this year, the management team at Iridium Communications decided recently to increase their guidance for the current fiscal year.
Read more on:
seekingalpha.com
Daniel Jones, Seeking Alpha, Aug. 02, 2022 11:15 PM ET

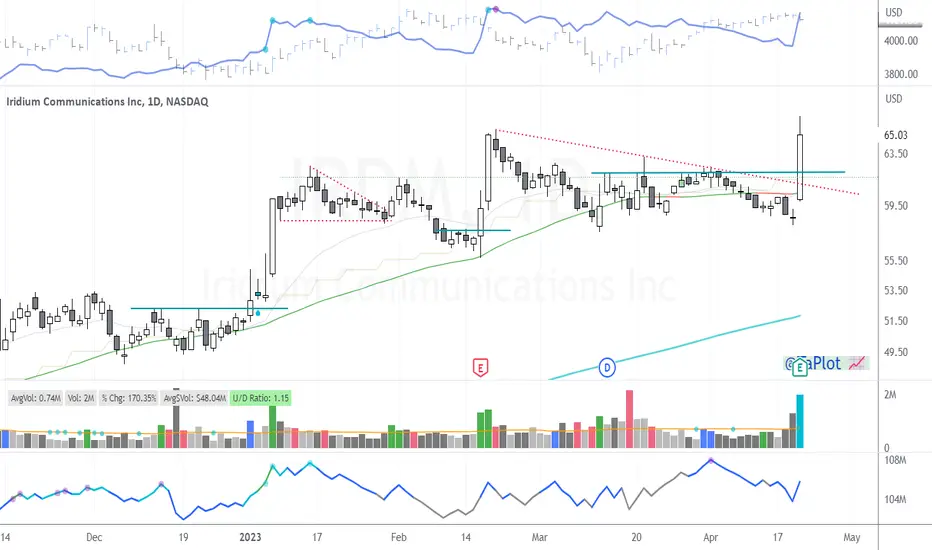
Long Trade in IRDMIridium Communications is a telecom stock in a clear uptrend. Shares have more than doubled over the last 12 months with clear support at the 50-day moving average.
The dashed white line on the chart highlights the area I have been watching - the HKEX:62 price level. This has been a key area of support and resistance and a likely place for IRDM buyers to step in and support the stock.
The 50-day moving average is here as well which should give additional support.
This is buyable here with a sell stop at $60.

IRDM Highest Up Volume in a YearIf you are a trend line breakout trader you might have caught this but that's not how I do it.
That said, NASDAQ:IRDM had its highest UP volume in a year.
She now goes into my larger watchlist and we get to be #paitent for it to setup again.
IRDM Iridium Communications Price TargetARK Invest is selling IRDM Iridium Communications for some time now. They timed the PayPal and Facebook selloff perfectly, so i expect they did the proper research before selling IRDM too.
In this case, my price target is the 28usd support level.
Looking forward to read your opinion about it.

Ascending Triangle$IRDM taking an initial position on the dip to breakout support in this ascending triangle.


IRDM BUY/LONG READY SOON! 29.00 to rise to potentially 80.00!TICKER CODE: IRDM
Company Name: Iridium Communications Inc.
Industry: Communication Services | Telecom Services | USA
Technical Analysis
1. Large Pennant / Falling Wedge Pattern Broke out and Retraced already
2. Large Head & Shoulders
3. Fibonacci Retracement (Potentially) to reach 0.786 (Silver Zone)
4. Fibonacci Expansion Safe Take Profit Level 1 (Grey Zone) Also the length of Flagpole
Entry: NOT YET READY! PREPARE FOR ENTRY AT 29.00-31.00
1st Partial Take Profit: 61.00
2nd Take Profit: 80.00 (Can consider to full take profit here) - Personally, I would hold this trade Long-term
EXPECTED Take Profit in September - December 2021

a breakout from consolidation can happen it would have happened yesterday if biden didn't do anything
i think it could go to about $45-$48 if this happens
it's a solid company and just beat earnings
IWM also looks ready to go boom
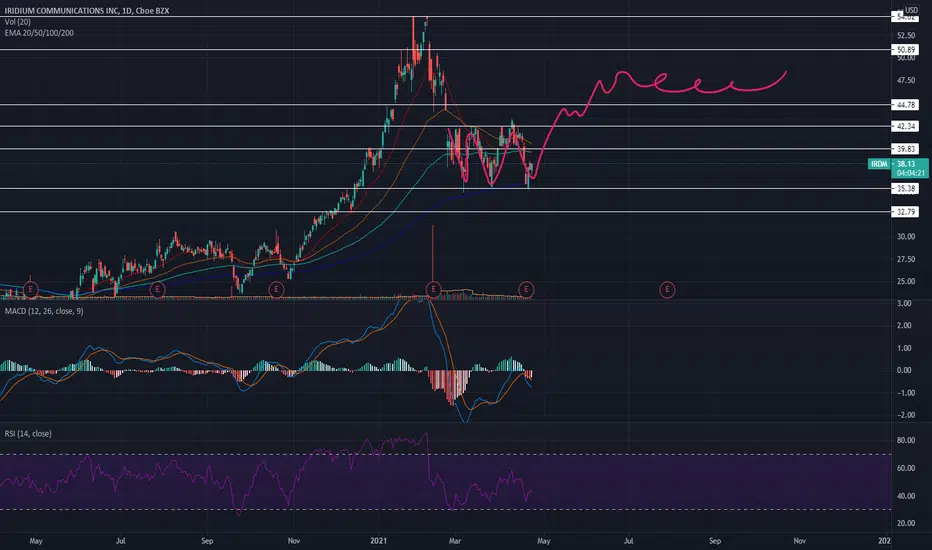

IRDM run up prior to next earnings reportI'm loving the symmetrical W pattern forming on IRDM. Once it pushes through the 50EMA and .618 fibs I expect this one to be off to the races. Price target could be the $62 if they turn a profit, but I expect it to reclaim recent highs at a minimum.
Pull Back Fishing ABC Bullish Inverse Head and ShouldersIRDM has pulled back quite a bit after forming what appears to be a double top.
Deep pull backs do not look good on the cloud as a rule. The cloud also changes like indicators, moving averages and patterns. Everything changes.
Right now the cloud looks bearish. The Tenka is under the Kijun. The chikous span is level with price. It would be bullish if the Chikou was above price. There is a bearish cross in the projection field ahead as and Span A is below Span B. The cloud is not pointing down.
The cloud is not my favorite tool for pull back or bottom fishing, but I think it is great for a quick snapshot. A security usually does not look bullish when it is down this far.
Not a recommendation
Possible stop under C

Iridum has good price, to buy laterIridium may break out next days and we enter it after some drawdown.
It is also possible we see the drawdown right now, and can grab the stock this week cheaper.
No hurry :)

Iridium is ready to go?Signals are not approved today, but maybe while todays trading time, it will get the approval from MACD and maybe DMV for a long position.
Wait paciently till signal is in...

has potential to breakout, not ready yet though in my opinion had a nice breakout from its longterm trend channel but now its back under, look for the top trendline from 2020 to act as support and NOT resistance before entering! nice curling RSI too but the top trendline resistance is what worries me. im nuetral here
Iridium could be a good buy again at 35$Iridium is still a bullish stock, but you can get it cheaper soon. Be patient to buy it at lower price.
RSI and Volumn but for a short term down trend, which may break the next support lines.
Keep an eye on it and maybe buy in March 21
