Daily Market Update for 3/8Trend lines drawn from the 2/16 ATH (15d), 3/2 (5d) and today 3/8 (1d).
Ideas always welcome in the comments. Errors will be amended as comments on TradingView or corrected inline in my blog.
-=x=-=x=-=x=-=x=-=x=-=x=-=x=-
Monday, March 8, 2021
Facts: -2.41%, Volume lower, Closing range: 2%, Body: 73%
Good: Held above 12,600 as market closed
Bad: Could not hold short rally in morning, selling the rest of afternoon
Highs/Lows: Higher high, higher low
Candle: Short upper wick over a thick red body, no lower wick
Advance/Decline: More than one declining stock for every advancing stock
Indexes: SPX (-0.54%), DJI (+0.97%), RUT (+0.49%), VIX (+3.28%)
Sectors: Utilities (XLU +1.41%) and Materials (XLB +1.34%) were the top sectors. Communications (XLC -1.34%) and Technology (XLK -2.42%) were bottom.
Expectation: Lower
-=x=-=x=-=x=-=x=-=x=-=x=-=x=-
Market Overview
The rotation continues. It's not often that a rotation is so clearly seen, with the Dow Jones ending the day up nearly 1% and the Nasdaq ending the day down 2.41%. Nine sectors outperformed the broader S&P 500 index, while the other two sectors lost enough to bring down the index for a loss by the end of the day.
The Nasdaq closed the day with a -2.41% loss on lower volume. The closing range of 2% followed an afternoon of selling that formed the 73% red body underneath a small upper wick from the short morning rally. There were more declining stocks than advancing stocks.
The Dow Jones Industrial average (DJI) gained +0.97% for the day. The Russell 2000 (RUT) advanced +0.49%. The S&P 500 declined -0.54%.
The VIX volatility index rose +3.28%.
Utilities (XLU +1.41%) and Materials (XLB +1.34%) were the top sectors for the day, with 8 out of the 11 SPDR sectors advancing for the day. Communications (XLC -1.34%) and Technology (XLK -2.42%) were the bottom, weighted down by losses from large mega-caps that dominate the two sectors.
-=x=-=x=-=x=-=x=-=x=-=x=-=x=-
Economic Indicators
The US Dollar (DXY) continues to advance with a +0.45% gain today. It has now regained a support area from the second half of 2020.
Yields on the US 30y and 10y treasury bonds rose for the day. The 2y yield spiked above 1.5 again with a 16% increase to 0.169.
High Yield Corporate Bonds (HYG) and Investment Grade Corporate Bond (LQD) prices both dropped.
Silver (SILVER) and Gold (GOLD) both declined for the day. Crude Oil (CRUDEOIL1!) pulled a bit back from its recent advance. Timber (WOOD) advanced. Copper (COPPER1!) advanced while Aluminum (ALI1!) declined.
-=x=-=x=-=x=-=x=-=x=-=x=-=x=-
Investor Sentiment
The put/call ratio dropped to 0.633. The put/call ratio (PCCE) is a contrarian indicator that shows overly bullish or overly bearish investor behavior. The 0.7 level is considered normal. As it approaches 0.60 (overly bullish) and below, watch for a possible pullback in the market.
The CNN Fear & Greed index moved toward the greed side.
-=x=-=x=-=x=-=x=-=x=-=x=-=x=-
Market Leaders
All four big mega-caps declined for the day. Alphabet (GOOGL) and Apple (AAPL) had the biggest losses with -4.27% and -4.17% declines. Microsoft (MSFT) declined -1.82%. Amazon (AMZN) declined for -1.62%. All four are trading below their 21d EMA and 50d MA. They continue to weigh down the indexes and their respective sectors as they have an overweight impact due to their size.
Several mega-caps did very well for the day. Walt Disney (DIS) gained +6.27% for the day. Roche Holding (RHHBF) gained 5%. Oracle (ORCL) and Cisco Systems (CSCO) proved not all is bad for mega-cap tech stocks with gains of around 3% each. Mastercard (MA) and Visa (V) also appeared at the top of the mega-cap list. PayPal (PYPL), Taiwan Semiconductor (TSM), Tesla (TSLA), and Nvidia (NVDA) occupied the bottom of the list with over 5% losses each.
Growth stocks tracked by the daily update were mostly down for the day. Dr Horton (DHI), Draft Kings (DKNG), Ehang Holdings (EH) and Penn National Gaming (PENN) all had gains for the day. FUTU Holdings (FUTU), UP Fintech (TIGR) both were hit with greater than 10% declines. Digital Turbine (APPS) declined a huge 16.32% and is nearly 40% below its all-time high set less than a week ago.
-=x=-=x=-=x=-=x=-=x=-=x=-=x=-
Looking ahead
The EIA Short-Term energy outlook will be released before market opens on Tuesday. After market close, the API Weekly Crude Oil stock numbers will be released. The house is expected to vote on the stimulus bill on Tuesday.
MongoDb (MDB) and Open Lending (LPRO) will report earnings tomorrow.
-=x=-=x=-=x=-=x=-=x=-=x=-=x=-
Trends, Support and Resistance
The trend line from the 2/16 ATH is pointing to a +0.60% gain for tomorrow that would be a nice bounce the 12,600 area.
The one-day trend line is pointing to a -1.63% which would test the 12,400 low from Friday. The five-day trend line points to a -2.19% loss, breaking thru the 12,400 mark.
We've been keeping an eye on a head and shoulders pattern. This pattern represents an attempt to move back to new highs that was rejected at a previous resistance point. Typically the height of the head is measured to determine the potential move downward that will occur as the price breaks below the neck line, which occurred last week.
I've also been cautioning that the drop would not happen in a straight line. Expect some back-and-forth as the index looks for a bottom. The target low from the pattern is 6.3% below Monday's close. Of course, the index could move lower than that point.
-=x=-=x=-=x=-=x=-=x=-=x=-=x=-
Wrap-up
Although the expectation set for today was sideways or higher based on Friday's candle, I also noted the weak volume in the rebound on Friday that gave me concern about holding the gains into Monday. Today's sell-off was also at low volume, so it did not really set a decisive direction for the index. Nonetheless, buyers of Nasdaq mega-cap stocks were missing even as the index dipped to a lower close.
Given the thick red bodied candle, the expectation for tomorrow is lower. The passing of the stimulus may provide some support to some segments of stocks but it may also stoke more fears of inflation and rising interest rates that have pulled down big tech and growth stocks.
Keep an eye out for stocks that are preforming well relative to the indexes and put them on your watch list.
Stay healthy and trade safe!
IXIC trade ideas

NASDAQBreak down H&S shoulder pattern.
0.618 support line should be first support, not reversal until price is above neckline

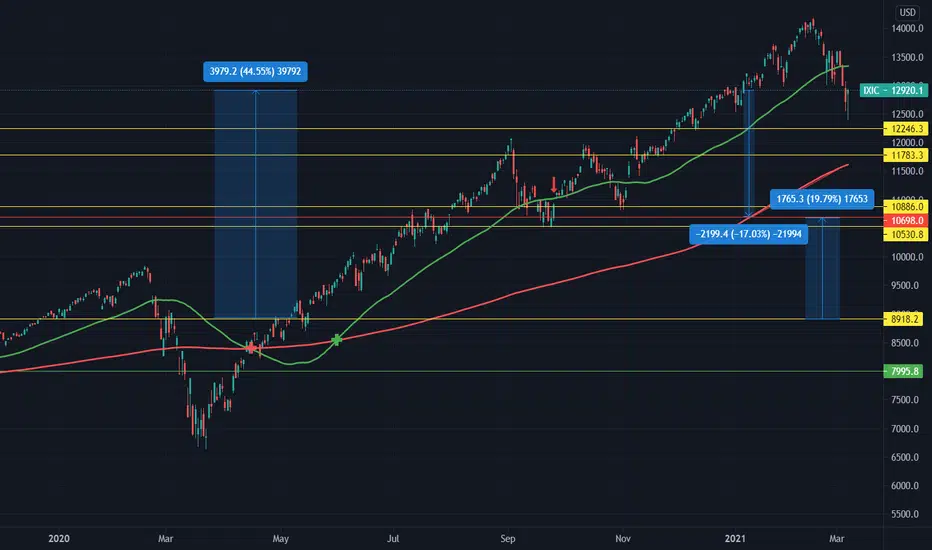
IXIC Valuation vs Overall Market and Possible Next Correction Starting with boji1's analysis AMEX:SPY/3.795+NASDAQ:QQQ/2.065+AMEX:DIA I have come to the theory that perhaps the overall market isn't in the kind of bubble everyone is touting, but in stead tech heavy bubble. Overall, the markets are up roughly 20%, with IXIC by itself up 44% using support levels found prior to the March 2020 crash. If we look at the IXIC as requiring a healthy correction to achieve a reasonable valuation based on overall market valuations, while preserving some topside valuation for the tech market, as there will be, in my opinion, long term tailwinds from the forced integration into mainstream society of companies like TDOC, ZM, PYPL, etc, because of the quarantine, we can estimate a reasonable valuation of around 20% above pre March 2020 levels with the assumption that of the all of the increases in use of these technologies, 20% will be preserved. This would represent a further 17% correction of the IXIC, and would, again in my opinion, bring the values and market caps of many of the companies in the IXIC back to reasonable levels. Obviously, this is assuming many things, and making some educated guesses, but I think this in a conservative estimation.
This does not necessitate leaving tech positions all together, but instead require a hard look at trimming or hedging some of those positions.
Market Week In Review - 3/1/2021 - 3/5/2021The Market Week in Review is my weekend homework where I look over what happened in the previous week and what might come in the next week. It helps me evaluate my observations, recognize new data points, and create a plan for possible scenarios in the future.
I do occasionally have some errors or typos and will correct them in my blog or in the comments on TradingView. I do not have an editor and do this in my free time.
If you find this helpful, please let me know in the comments. I am also more than happy to add new perspectives and data points if you have ideas.
The structure is the following:
A recap of the daily updates that I do here on TradingView.
The Meaning of Life, a view on the past week
What's coming in the next week
The Bullish View, The Bearish View
Key index levels to watch out for
Wrap-up
If you have been following my daily updates, you can skip down to the “The Meaning of Life”. If not, then this first part is a great play-by-play recap for the week. Click the original charts for more detail each day.
-=x=-=x=-=x=-=x=-=x=-=x=-=x=-
Monday, March 1, 2021
Facts: +3.01%, Volume lower, Closing range: 97%, Body: 78%
Good: Strong buying throughout day, close above 21d EMA
Bad: Nothing
Highs/Lows: Higher high, higher low
Candle: Thick green body with short upper/lower wicks, slightly longer lower wick
Advance/Decline: More than three advancing stocks for every declining stock
Indexes: SPX (+2.38%), DJI (+1.95%), RUT (+3.37%), VIX (-16.46%)
Sectors: Technology (XLK +3.22%) and Financials (XLF +3.13%) were top. Consumer Staples (XLP +1.01%) and Real Estate (XLRE +0.11%) were bottom.
Expectation: Higher
Monday kicked off the week with an upside reversal from last week's downtrend. A small gap up was closed early in the session that was dominated by buying the rest of the day. The gains were large and broad across the market as manufacturing data released in the morning was better than expected.
The Nasdaq closed the day with a +3.01% gain. Volume was lower than Friday. The closing range of 97% represented the buying that continued into close after gains throughout the day created a 78% green body. More than three stocks gained for every declining stock.
-=x=-=x=-=x=-=x=-=x=-=x=-=x=-
Tuesday, March 2, 2021
Facts: -1.69%, Volume lower, Closing range: 3%, Body: 97%
Good: Stayed above 50d MA
Bad: All red body, no visible upper/lower wicks, back below 21d EMA
Highs/Lows: Higher high, lower low
Candle: Marubozu black candle with no wicks, all red body, outside day
Advance/Decline: More than three declining stocks for every advancing stock
Indexes: SPX (-0.81%), DJI (-0.46%), RUT (-1.93%), VIX (+3.21%)
Sectors: Materials (XLB +0.56%) only gaining sector. Consumer Discretionary (XLY -1.15%) and Technology (XLK -1.59%) were bottom.
Expectation: Sideways or Lower
The market gave up half of yesterday's gains in a continuation of two weeks of choppiness as investors await a stimulus bill that will have both positive and negative impacts on equities. Today's expectation breaker after yesterday's session requires a deeper look to understand. Investment has been rotating in and out of Consumer Discretionary and Technology for the past two weeks.
The Nasdaq closed the day with a -1.69% decline on lower volume. The 97% red body with no visible upper and lower wick forms a Marubozu (shaven head) candlestick. The 3% of lower wick was formed in just the last few minutes of trading as most of the day was dominated by selling. There were three declining stocks for every advancing stock.
-=x=-=x=-=x=-=x=-=x=-=x=-=x=-
Wednesday, March 3, 2021
Facts: -2.7%, Volume higher, Closing range: 1%, Body: 90%
Good: 13,000 just barely holding on
Bad: Higher volume selling day shows institutional distribution
Highs/Lows: Lower high, lower low
Candle: Tiny upper wick created at open, thick red body with no lower wick
Advance/Decline: More than two declining stocks for every advancing stock
Indexes: SPX (-1.31%), DJI (-0.39%), RUT (-1.06%), VIX (+10.66%)
Sectors: Energy (XLE +1.47%) and Financials (XLF +0.78%) were the top sectors. Consumer Discretionary (XLY -2.35%) and Technology (XLK -2.52%) were bottom.
Expectation: Sideways or Lower
The market continued its retreat on Wednesday with another session of selling that was shared broadly across the indexes. Only a few cyclical sectors were able to hang onto gains for the day as investors moved from high priced big tech and consumer discretionary stocks to recovery stocks expected to benefit from the economic recovery.
The Nasdaq closed the day with a -2.70% loss on higher volume, marking a clear distribution day for the index. For a second day in a row, the index sold off for most of the day, producing a thick red body with no visible lower wick. The closing range was 1% and the red body covers 90% of the candle. Over two stocks declined for every advancing stock.
-=x=-=x=-=x=-=x=-=x=-=x=-=x=-
Thursday, March 4, 2021
Facts: -2.11%, Volume higher, Closing range: 33%, Body: 45%
Good: Support at 12,550 area
Bad: Rejected at 13,000, new low for year
Highs/Lows: Lower high, lower low
Candle: Red body in center of candle with upper and lower wicks from choppy session
Advance/Decline: Over seven declining stocks for every advancing stock
Indexes: SPX (-1.34%), DJI (-1.11%), RUT (-2.76%), VIX (+7.12%)
Sectors: Energy (XLE +2.39%) was the only sector with gains. Consumer Discretionary (XLY -2.12%) and Technology (XLK -2.21%) were bottom.
Expectation: Lower
The sky is not falling. But the market is! It can be confusing to see the news of reopening of economies around the US and world, positive signs of economic recovery, and yet to have the market be correcting at the same time. Thursday continued the market slide, caused by investor's fears that the economy will recover too fast and inflation will take off beyond the desired 2% that the fed targets, impacting negatively the valuations of mega-caps and growth stocks.
The Nasdaq closed down another -2.11% on much more volume than the previous two sessions. The closing range was a little better at 33%, but still not great. The 45% red body sits in the middle of the candle with an upper wick created by a morning rally to 13,000 and a lower wick created by the afternoon dip to 12,550. The support at 12,550 was expected, but may be temporary. There were over seven declining stocks for every advancing stock.
-=x=-=x=-=x=-=x=-=x=-=x=-=x=-
Friday, March 5, 2021
Facts: +1.55%, Volume lower, Closing range: 96%, Body: 11%
Good: Morning selling turned into afternoon buying, high closing range
Bad: Shrinking volume into afternoon, lower high, lower low
Highs/Lows: Lower high, lower low
Candle: The long lower wick shows the morning selling was bought back for a rally into afternoon
Advance/Decline: About three advancing stocks for every two declining stocks
Indexes: SPX (+1.95%), DJI (+1.85%), RUT (+2.11%), VIX (-13.69%)
Sectors: Energy (XLE +3.74%) and Industrials (XLI +2.37%) were the top sectors. Real Estate (XLRE +1.15%) and Consumer Discretionary (XLY +0.64%) were bottom.
Expectation: Sideways or Higher
The week ended with some positive market gains to take into the weekend. It's a start, but there are still several tests for the indexes to pass and prove investors are here to stay and rally next week.
The Nasdaq closed the day with a +1.55% on slightly lower volume than the previous day, but higher than average. The closing range was a high 96% with a thin body of 11% that rests above a very long lower wick. There were three advancing stocks for every two declining stocks.
-=x=-=x=-=x=-=x=-=x=-=x=-=x=-
The Meaning of Life (View on the Week)
There is a lot to look at in reviewing this past week's market. An outsized rotation among sectors presented itself as a correction in the Nasdaq. The rotation pulled the index down 10% from all-time highs, the level typically viewed as correction in a market. If you kept your eyes only on the Nasdaq, you might have missed that eight out of the eleven sectors defined by the SPDR ETFs ended the week with positive gains. Several sectors never dipped into the negative.
The question on my mind and many investors' minds is where does it go from here. Of course, the market will always do what the market wants to do. But we can pick apart some of the signals we have in front of us and build some expectations for the coming week. From those expectations, I build a game plan to make sure I'm protected from further loss but also don't miss a potential huge buying opportunity.
Monday started the week with a huge positive gain coming off the tough previous week. Stimulus progress over the weekend and some easing of concerns over inflation brought the buyers back into tech stocks. Things looked good and I set an expectation for higher on Tuesday.
That expectation was busted over the next three days. Tuesday's candle set off alarms with no upper and lower wick; just a tick red body. A short-lived rally midday couldn't fend off the bears as the index moved back toward the 50d moving average line. Wednesday continued to sell, but still closed above the 13,000 support area that held several times since the beginning of the year. That area also marked a neck line in a head and shoulders pattern on the chart. Thursday broke the neck line and sent the index back to 12,500 area and erasing the year to date gains.
That brings us to Friday. The day was confusing to me. Much of the media claimed victory for the markets as a result of better than expected employment data. That data came at 8:30 in the morning, but the market opened with high volume distribution that didn't stop until 11:30. For the Nasdaq, the selling stopped right at 12,400 and the rest of the day was accumulation, but at much lower volume. It was very similar to the intraday pattern on 2/23 which was followed by a low volume accumulation day on 2/24. 2/25 brought the worst distribution day since September.
The Nasdaq closed the week down -2.06% on higher volume. It's the third week in a row of distribution for the tech heavy index. The closing range for the week was 43%. That's not too bad for closing range and reflects the bounce on Friday that brought the other major indexes back to positive closes for the week.
The glaring characteristic on the weekly chart is the breakdown of the channel drawn from the March bottom. However, if you rewind the chart to the week of October 26th, the lower line of the channel drawn at that point was also violated (causing us to redraw the current channel). The following week was a 9% gain.
The S&P 500 (SPX) advanced +0.81%. The Dow Jones Industrial average (DJI) gained 1.82%. The Russell 2000 (RUT) lost -0.40% for the week.
The VIX volatility index closed the week with a -11.77% decline.
If you kept your eyes only on big tech and growth stocks, you might have missed that many sectors had fairly good advances this week. The sector chart supports the thesis that there is an outsized rotation in progress that is presenting as a correction, but that there is still a level of support in the broader equities market.
The top two sectors, Energy ( XLE ) and Financials ( XLF ), never dipped into negative territory even with Thursday's broad sell-off.
The other cyclical Industrials ( XLI ) and Materials ( XLB ) also performed well for the week. Materials was leading for the week at the end of Tuesday, but backed off a bit later in the week.
There was caution visible in the sectors as Utilities ( XLU ) and Consumer Staples ( XLP ) advanced. These are safe bet sectors during corrections.
Investors moved from sectors that are more exposed to pressures from inflation and higher yields. Consumer Discretionary ( XLY ) and Technology ( XLK ) were the hardest hit among the sectors. Real Estate ( XLRE ) is also at the bottom of the list.
At center stage is the bond market sell-off that is driving higher yields. Interest rates that are based on the yields will make borrowing costs higher. Add to that fears of higher inflation would bring interest rate adjustments earlier than initially expected. The higher interest rates benefit big banks that drive the Financials sector higher. But it depresses the future value that was priced into high growth sectors like Technology.
US 30y and 10y Treasury Bond yields continued to rise and widen the gap with shorter term treasury bonds. In addition the shorter term bonds, including the 2y, are experiencing a higher than usual level of volatility. That volatility makes them less useful as a hedge for investors, causing further selling and higher yields. Yields go up when bond prices go down.
High Yields Corporate Bonds (HYG) actually increased a bit after last week's dip. Investment Grade (LQD) corporate bond prices continued to decline.
The US Dollar (DXY) advanced +1.21% for the week.
The strengthening dollar comes at the expense of currencies that were doing well earlier in the pandemic cycle including the Australian Dollar and Swiss Franc. Those countries were seen as recovering faster than the United States. As the US economy picks up momentum, the US dollar will continue to strengthen.
Silver (SILVER) and Gold (GOLD) both declined for another week.
Crude Oil Futures (CRUDEOIL1!) had another week of gains as OPEC decided to not increase production.
Timber (WOOD) advanced for the week. Copper (COPPER1!) declined while Aluminum (ALI1!) gained for the week.
-=x=-=x=-=x=-=x=-=x=-=x=-=x=-
The Big Four Mega-caps
The four big mega-caps all had very different performance this week. Alphabet (GOOGL) did very well, gaining +3.72% for the week. Apple (AAPL) had a small gain, but still trades well below its 10w moving average. Microsoft (MSFT) had a -0.34% loss, but was able to close the week above the 10w moving average line. Amazon (AMZN) continued to move lower with a -2.99% and a close below the 40w moving average.
The recovery stocks I featured last week, with the exception of Exxon Mobil, had losses for the week. However, they are all trading above key moving average lines and still in upward trends. Exxon Mobil has almost doubled in price since November. That milestone could happen this week.
-=x=-=x=-=x=-=x=-=x=-=x=-=x=-
Looking Deeper at the Rebound
I want to take a deeper look at Friday's rebound after the morning dip. The timing didn't make much sense as I couldn't find any discernable catalyst to reverse the morning selling. The reverse happened around 11:30, two hours after the positive employment data hit the market. The reversal was also at a very odd round 12,400 for the Nasdaq.
The below chart is the intraday 15m chart and the thing that sticks out is the contrast of volume in the morning selling vs the volume as investors came in to buy the dip. This would indicate that larger institutions were distributing in the morning, but a smaller number of investors were accumulating in the afternoon. In fact, the Volume Weighted Average Price for the day did not regain positive territory.
-=x=-=x=-=x=-=x=-=x=-=x=-=x=-
Growth vs Value
I've shared growth vs value charts in the past that show the amazing parabolic difference between growth stocks and value stocks, especially in 2020 after the pandemic. February saw a dramatic dip in the chart as investors are moving from growth to value. That move started even before the scare around inflation and higher bond yields.
Even if the volatility in bonds gets under control, there is still going to be plenty of rotation in the system until value stocks have a chance to catch up a bit with growth stocks. That rotation is likely to continue putting pressure on the Nasdaq that carries a high percentage of high tech and growth stocks.
-=x=-=x=-=x=-=x=-=x=-=x=-=x=-
Investor Sentiment
The put/call ratio (PCCE) ended the week at 0.816, with investors still showing balance of bullish and bearish sentiment. A contrarian indicator, when the put/call ratio is below 0.7, it signals overly bullish sentiment which typically proceeds a pullback in the market. The indicator was at 0.458 just before the September correction and it was at 0.489 just before the short October correction. It hit a low of 0.503 two weeks ago leading into this correction.
The CNN Fear & Greed index moved is neutral.
Money managers are at a 65 leveraged level as measured by the NAAIM Exposure Index. That's down from being over 100 a few weeks ago.
-=x=-=x=-=x=-=x=-=x=-=x=-=x=-
The Week Ahead
The big news for Monday has already happened. The stimulus bill passed in the Senate along party lines and now moves to the House where it's expected to pass. The vote is scheduled for Tuesday.
Otherwise, there is not much other economic news planned for Monday.
The EIA Short-Term energy outlook will be released before market opens on Tuesday. After market close, the API Weekly Crude Oil stock numbers will be released. The house will vote on the stimulus bill on Tuesday.
Another look at inflation will come on Wednesday with the release of consumer price index data in the morning. Crude Oil Inventories data will come after the market opens. Maybe one of the most significant economic events for the week will be the 10y Note Auction at 1pm.
Thursday will bring an update to Initial Jobless Claims and the JOLTs Job Openings report. Both are expected to improve over previous numbers.
Friday's producer price index data will complement the consumer price data earlier in the week. In addition, the inflation expectation and consumer sentiment numbers released after the market opens will be watched closely.
Earnings reports will again be dominated by smaller cap companies.
Earnings reports on Monday will include Livongo (LVGO), Niu Tech (NIU), Gohealth (GOCO).
On Tuesday, MongoDb (MDB) and Open Lending (LPRO) will report.
Oracle (ORCL) will report on Wednesday. Joining Oracle, will be Campbell Soup (CPB), Cloudera (CLDR) and Sumo Logic (SUMO).
JD.com (JD) is the big mega-cap reporting on Thursday before market opens. DocuSign (DOCU) and Celsius (CELH) will also report Thursday.
Shard (SHCAY) will report earnings on Friday before market open.
Be sure to check for scheduled earnings reports for stocks in your own portfolio.
-=x=-=x=-=x=-=x=-=x=-=x=-=x=-
The Bullish Side
Should we start, or end with the $1.9 trillion stimulus bill. Or both. It's a near certainty that the bill will pass through the house this week with the vote scheduled for Tuesday. The bill will include stimulus checks to be paid out based on household size and income. Additional money will be put toward vaccinations and testing. There is aid for state and local governments facing higher costs and lower tax revenue. Critical infrastructure projects, including broadband internet, were added to the bill this week. There is a plethora of other protections for families struggling in the pandemic with unemployment, rent and health insurance. Airlines, Airports and Small Businesses will get extra support.
All of that could be a catalyst to more spending by consumers. In addition to the stimulus checks going toward new purchases, there is a record amount of consumer savings accumulated during the pandemic. Debt is at all-time lows. As the lockdowns are lifted, consumers will want to get out and spend money, especially on long-overdue vacations.
Despite the distribution on the Nasdaq, the S&P 500 and the Dow Jones Industrial average had good weeks. The number of sectors that ended the week with gains supports the thesis that an oversized rotation from growth stocks to value stocks has presented itself as a correction, but underneath the charts is still broad support for the equities markets among investors.
-=x=-=x=-=x=-=x=-=x=-=x=-=x=-
The Bearish Side
The shock in the bond markets and impact on equities is far from over. As the dollar gains strength and consumer spending picks up after the stimulus, there will certainly be more pressure on bond prices, sending yields even higher. That will not only impact the cost of servicing debt in high growth companies, but will increase adjustable mortgage payments based on the bond yields.
With the increased consumer spending expected after the stimulus, inflation will be closely watched by investors. If the economy overheats, the fed will be forced to rethink monetary policy. When that happens we could find ourselves in another 'taper tantrum'. The term was given to the surprise on May 22, 2013 when investors found the fed would reduce bond purchasing. Yields rose as bond prices dipped and small pull back occurred in equity markets over the next few weeks. Only this time around, the impact is likely to be much bigger to match the unprecedented amount of quantitative easing being used to prop the economy.
The rebound in prices on Friday was a welcome change. However, the volume profile throughout the day gives the appearance that big institutions were distributing. The accumulation in the afternoon came with much smaller volume as possibly investors were buying the dip. Those kind of weak gains don't last long.
-=x=-=x=-=x=-=x=-=x=-=x=-=x=-
Key Nasdaq Levels to Watch
The index has several tests to pass this week to build confidence in a rally attempt.
First on the positive side:
First, the index needs to close back above the 13,000 support/resistance area. That area has been the pivot point for several rallies and dips since early December. That would also bring the index back above the neck line of the head and shoulders pattern.
The next goal will be to close back above the 50d moving average, currently at 13,340.74. Sustaining prices above that line will bring the 10d MA back up above the line also, signaling an uptrend.
The 21d EMA is approaching a cross under the 50d MA. The index needs to get above 13,390.23 to put the 21d EMA back in an uptrend.
13,601.33 is the high of this past week. Make a higher high while also providing a higher low to end the downtrend on the weekly chart.
14,000 will be the next area of resistance. The index spent only 5 days above this mark.
The all-time high is at 13,175.12. That might be a stretch to get there this week, but keep it in our sites.
On the downside, there are several key levels to raise caution flags:
At 12,757.61, the Nasdaq is 10% below the all-time high, a significant level for investors.
12,500-12,550 is a support area that held on Thursday before the index broke below it on Friday.
12,397.05 is the low of the past week where the index started its upside reversal on Friday.
Several possible areas of support at 12,550, 12,250, and 12,000.
The 200d MA is about 10% below the index at 11,622.33.
-=x=-=x=-=x=-=x=-=x=-=x=-=x=-
Wrap-up
The Nasdaq moved into "official" correction this week as it dipped more than 10% off all-time highs. But there is more than what appears at the surface in the index chart. The rotation from growth to value and mega-cap to small-cap really started in early August and is now accelerating as the economy begins to show more signs of recovery.
If you've been investing in growth stocks, it's probably been a tough few weeks. Many of those companies will show great performance, but their stock prices may still come down as investors weigh the net present value of those investments vs value stocks that are due to grow in 2021.
Now is a great time to take a look at your watch lists. Trim the stocks that are performing worse than the rest of the market. Add stocks that are doing well relative to the dip in the market.
The correction status remains and it's not a great time to make big bets until the market confirms a rally. But don't check out. Keep an eye on the daily moves and look for a few days of gains on higher volume and regaining a key moving average line like the 21d EMA. Those will be solid signs that investors are accumulating again and risk is lower.
Good luck, stay healthy and trade safe!

IXIC Overvaluation Analysis and Subsequent Hedging StrategyIXIC Overvaluation Analysis and Subsequent Hedging Strategy
This is a bit late, but I wrote it on 2/25. Perhaps it will still be helpful.
*Background: To prevent repetition: all analysis presented is based on the monthly view of IXIC and all data given will be therefore based on that chart unless otherwise specified.
Prior to the 2000 “Dotcom Crash”, the IXIC had a brief correction of roughly 20% lasting roughly 92 days or 3 bars. After this correction the IXIC rallied in a spectacular bull market gaining 220% in valuation over a period of roughly 547 days or 18 bars. After this subsequent peak, during the 2000 “Dotcom Crash,” the value of IXIC initially corrected its valuation by 27.8% over 61 days or 2 bars. Immediately prior to this valuation correction, the RSI rose 73% to a peak value of 85.5. The IXIC then stabilized, as is supported by the RSI stabilization, and it can be reasonably assumed that this temporary stabilization is due to adequate volume support (the reports of which are unavailable), for a further 151 days or 5 bars. Then the IXIC further corrected its valuation 65%+ over 732 days or 24 bars, which was accompanied by a drop in RSI to a low of 33.
Our current bull run has been similarly preceded by a relatively minor and short lived correction related to the economic impact of SARS-CoV-19. This “Covid Correction” has been followed by a IXIC valuation increase of 76% from the bottom of the previous correction. Based on this most reasonably similar event, the 2000 "Dotcom Crash," the current IXIC market has a further upside potential of between 45% if the final valuation increase is 150%, 65% if the final valuation increase is 200%, and 80% if the final valuation increase is 230%, based on overall IXIC valuation. Based on the same comparison between the peak of the RSI prior to the initial correction in 1999, the IXIC has a further RSI upside of roughly 11% to 85 from its current value of 76.
Based on valuation and current IXIC trends there are possible tops around 6/21 with a 19450 IXIC valuation (150% final market valuation increase or MVI); 9/21 with possible IXIC valuations of 19587 and 22283 (150-200% final MVI); 1/22 with a possible IXIC valuation of 22283 (200% final MVI). On the outside, with a final MVI of 230%, we see possible tops at 11/21, and 4/22 with a 24300 market valuation. It seems unlikely that because of the proximity of the RSI to peak RSI values (11%) that a further 80% market valuation will occur. The key deciding factor in the final IXIC valuation, I believe, will be the timing of the peak RSI of 85 with the current IXIC market valuation. It seems reasonable to act on an RSI of 85 given current market conditions and past corrections occurring with an RSI of 85.
Theory: when peak market valuations are met with a peak RSI of 86.28, which represents a 13% increase from current RSI of 74.89, the market will be compelled to revise the valuation of the tech sector specifically. This RSI/market valuation link seems, based on past corrections, to be key. If the IXIC reaches valuations stated above without correlating RSI values of 85+, the chance of a major market correction is lower as a correction without an RSI of 85+ is unsupported by past examples. Based on previous samples (the 2000 "Dotcom Crash," the 2008 "Housing Market Bubble," and the 2018 "Banking Crisis"), the initial downside potential is at or around 30-40% with SPX and DJI following the downside trend and momentum with similar results. This initial correction will most likely take place over a range of 45-90 trading sessions or 2-6 months.
After the initial market correction, the bulls will most likely step in and secure a volume support which will sustain the market in a flat trajectory for a likely period of 6 to 8 weeks, after which there could be further downside potential based on the market valuation at the peak of the valuation prior to the initial correction. A further hypothetical correction based on the 2000 crash has the potential to bring the total IXIC correction to 70%, however unlikely. A more likely scenario is a further correction of 30% followed by a volume support stabilization taking place over a time frame of up to 2 years. These corrections, after the 1999 crash, took 13 years to be reclaimed after their final bottom. This brings the total event to roughly 15 years. The 13 years following the 2000 correction traded as a modest bull market which would present opportunities to earn back some lost capital.
Keys:
Watch for large downside market movements at:
-6/21 with a market valuation of 19450 and RSI of 85+
-9/21 with a market valuation between 19450 and 22283 and an RSI of 85+
-11/21 with a market valuation of 24300 and an RSI of 85+
-1/22 with a market valuation at 22283 and an RSI of 85+
-4/22 with a market valuation of 24300 and an RSI of 85+
-**RSI is historically a key metric**
Strategy:
-Hedge all positions with a maximum loss goal of 10% over the entire course of the correction
->Hedging strategy can consist of a buy/write covered call strategy while purchasing a put against the held shares with a net credit
->Limited upside gain caused by the covered calls can be alleviated by going long with a call on the same position with a strike above the sold covered call
-If the metrics outlined above are met and the market begins to act as if a correction is iminent, i.e. increasing prices with decreasing MACD, RSI, or volume consider:
->Purchasing additional put contracts out of the money but within the projected downside percentage within the projected timeline
->>i.e. QQQ put at a strike with a $6-10 price and a exp of 6 weeks
->>> A subsequent downside of 30% within that timeframe will net a 8.5x return at maximum downside, therefore, every $1000 purchased would net a $8260 profit
-Continuing reevaluation of market conditions are necessary
Possible outcome example:
-With an investment of $20000 into puts against QQQ; on 30% downside of QQQ: Gross profit =$147700 at 8.5x return. This can then be reinvested in PMI earning blocks (100 shares) within the lots (divisions of investable income based on stock holdings) already established to further compound returns. This gross profit will offset any losses occurring during the market downturns, which will be around 10% with proper hedging vs the market correction of 30-70%.
My personal strategy will be to hedge all positions using covered call premiums to purchase puts with a net credit, and ensuring these hedges are in place when the RSI is above or trending strongly towards 80. I will be minimally hedging all tech positions regardless of RSI value in relation to the volatility of the current market and the high probability of short term 20% corrections because of outside socioeconomic factors and the internal behavior of the market.
Strategy for second move downwards:
The second devaluation of the 2000 crash took 2 years to reach the bottom. This happened as the market behaves: unpredictably and incrementally.
-Continue to purchase puts against QQQ considering reinvesting a portion of the capital gained from the initial put purchase to continue to either hedge against continued losses, or to generate income
-Continue to hedge individual stocks by selling covered calls and hedging the position by purchasing puts with a net credit
-> This will either limit losses in large downward moves or provide income to offset the losses and bring the cost bias of the shares held down to further future upside potential
-> Continue to attempt to enact the PMI (passive monthly income) strategy with a goal rate of 10% yearly ATPI (after taxes, premiums, and inflation)
-Use the capital gained to purchase blocks of high growth/high IV companies and value companies to continue to generate PMI at a goal rate of 10% ATPI
**Watch for a lower market valuation than mentioned above paired with an RSI of 85+ as this may indicate a preemptive market correction. As always, the market is unpredictable**
Post full correction:
Any capital gained from the purchase and sale of puts should be reinvested into the strategy of choice based on previously established plan, i.e. reinvesting into PMI value stocks and high growth, high IV (implied volatility) stocks at a 3:1 ratio where high IV stocks will be able to fetch higher covered call premiums thus maximizing consistent, repeatable returns.
-PMI value stocks mentioned above are a set of stocks of criteria I have created to establish that a company is worth investing in, is priced well, and can generate 1.5% passive monthly income (PMI) through the sale of covered calls and yearly dividends. This is based on my personal goal of a minimum 10% yearly return after taxes and inflation. This strategy will increase the likelihood of positive yearly returns in a bear market scenario if one should arise.
Disclaimer:
These analyses are based on the monthly chart comparing the current IXIC trends with past market corrections which were also analyzed in the monthly chart view. There were no obvious correlations between MACD and Stochastic and no data was available for On Balance Volume. There was, however, a correlation between the market trend vs Bollinger Bands, wherein the candles rode the very upper limit of the Bollinger Bands, with the last candle at the peak of the 1999 bull market breaking the upper limit of the Bollinger Bands completely. However, this breakout is not repeated for the 2008, 2018, or 2020 corrections and all trends rode the very upper limit of the Bollinger Bands prior to correction. For these reasons I found no meaningful data to convince me to include Bollinger Bands in the analysis or preemptive planning for a future market correction. This is stated to illustrate that the analysis given in this article is A: not comprehensive, and B: should not be taken as a sole factor in your decision to act on current and future market conditions. As always, it is best to do your own research and draw your own conclusions. Good luck and hedge up.


The development of the market for the next few months - Nasdaq NASDAQ:IXIC Just sharing my thoughts guys.
If the drop has finally ended on friday, then the correction during (feb to march) is around 12.51% and which is quite similar to last year 2020 Sep correction which is around 12.58%. If the market did not further drop next week, I am thinking that the market might be trading side ways for the few months which is quite similar to the development of the market last year after September correction?
What do you guys think? just curious will the market develop the way as i thought.


Daily Market Update for 3/5Trend lines drawn from the 2/16 ATH (14d), 3/1 (5d) and today 3/5 (1d).
Ideas always welcome in the comments. Errors will be amended as comments on TradingView or corrected inline in my blog.
-=x=-=x=-=x=-=x=-=x=-=x=-=x=-
Friday, March 5, 2021
Facts: +1.55%, Volume lower, Closing range: 96%, Body: 11%
Good: Morning selling turned into afternoon buying, high closing range
Bad: Shrinking volume into afternoon, lower high, lower low
Highs/Lows: Lower high, lower low
Candle: The long lower wick shows the morning selling was bought back for a rally into afternoon
Advance/Decline: About three advancing stocks for every two declining stocks
Indexes: SPX (+1.95%), DJI (+1.85%), RUT (+2.11%), VIX (-13.69%)
Sectors: Energy (XLE +3.74%) and Industrials (XLI +2.37%) were the top sectors. Real Estate (XLRE +1.15%) and Consumer Discretionary (XLY +0.64%) were bottom.
Expectation: Sideways or Higher
-=x=-=x=-=x=-=x=-=x=-=x=-=x=-
Market Overview
The week ended with some positive market gains to take into the weekend. It's a start, but there are still several tests for the indexes to pass and prove investors are here to stay and rally next week.
The Nasdaq closed the day with a +1.55% on slightly lower volume than the previous day, but higher than average. The closing range was a high 96% with a thin body of 11% that rests above a very long lower wick. There were three advancing stocks for every two declining stocks.
The major indexes all did well with the S&P 500 (SPX) gaining +1.95% and the Dow Jones Industrial average (DJI) gaining +1.85%. The Russell 2000 (RUT) had the best day with a +2.11% as small caps recovered from yesterday's sell-off.
The VIX volatility index retreated -13.69%.
All sectors ended the day with gains. Energy (XLE +3.74%) and Industrials (XLI +2.37%) led the sectors with the biggest gains, driven by a positive outlook for the economic recovery as job numbers came in higher than expected. At the bottom of the list were Real Estate (XLRE +1.15%) and Consumer Discretionary (XLY +0.64%).
-=x=-=x=-=x=-=x=-=x=-=x=-=x=-
Economic Indicators
The US Dollar (DXY) continues to advance with a +0.38% gain today.
Yields on the US 30y and 10y treasury bonds remained about the same. The 2y yields declined for the day as short term bonds continue to trade with high volatility.
High Yield Corporate Bonds (HYG) prices rose while Investment Grade Corporate Bond (LQD) prices dropped slightly.
Silver (SILVER) declined while Gold (GOLD) advanced, both making small moves. Crude Oil (CRUDEOIL1!) futures made another big advance. Timber (WOOD) advanced. Copper (COPPER1!) and Aluminum (ALI1!) both advanced.
-=x=-=x=-=x=-=x=-=x=-=x=-=x=-
Investor Sentiment
The put/call ratio rose to 0.816, remaining high compared to the past few months of overly bullish sentiment. The put/call ratio (PCCE) is a contrarian indicator that shows overly bullish or overly bearish investor behavior. The 0.7 level is considered normal. As it approaches 0.60 (overly bullish) and below, watch for a possible pullback in the market.
The CNN Fear & Greed index is neutral.
-=x=-=x=-=x=-=x=-=x=-=x=-=x=-
Market Leaders
All four big mega-caps advanced for the day. Alphabet (GOOGL) had the biggest move with a +3.10%, not needing to content with resistance at moving average lines. Microsoft (MSFT) moved back above its 50d MA with a +2.15% gain. Apple (AAPL) and Amazon (AMZN) also had gains, but are still trading well below their 21d EMA and 50d MA lines.
Most mega-caps gained for the day, with Oracle (ORCL), Taiwan Semiconductor (TSM), Chevron (CVX) and Intel (INTC) leading the list with greater than 4% gains. Tesla (TSLA) did not find its way back into positive territory after the morning selling, closing the day with a -3.78% loss.
Growth stocks were mixed. Paycom software gained +7.70%, likely benefiting from the strong employment data. FUTU Holdings (FUTU) and Dr Horton (DHI) also had big days with over 5% gains. Not all growth stocks recovered from the morning selling. Digital Turbine (APPS) closed with a -6.12% loss after dipping more than 16% in the morning. It was a similar story for CrowdStrike (CRWD), Chewy (CHWY) and MongoDB (MDB).
-=x=-=x=-=x=-=x=-=x=-=x=-=x=-
Looking ahead
There is not much scheduled economic news to kick-off the week on Monday. We might have an update on the stimulus bill over the weekend that could impact markets.
Earnings reports on Monday will include Livongo (LVGO), Niu Tech (NIU), Gohealth (GOCO).
-=x=-=x=-=x=-=x=-=x=-=x=-=x=-
Trends, Support and Resistance
If today's afternoon rally continues into Monday, the one-day trend line points to a +3.05% gain on Monday that would take the index back to just below the 50d MA.
The trend-line from the 2/16 ATH is pointing to a -1.10% decline for Monday. The five-day trend line points to a -3.98% loss.
The index dipped below the 12,550 support area today before rallying and falling short of 13,000. We could count 12,400 as support which is where the index dipped to today.
This week, we've been keeping an eye on a head and shoulders pattern. This pattern represents an attempt to move back to new highs that was rejected at a previous resistance point. Typically the height of the head is measured to determine the potential move downward that will occur as the price breaks below the neck line. The index is still below the neck line, so the pattern is still worth watching.
I've also been cautioning that the drop would not happen in a straight line. Today's bounce back from the intraday low could be a temporary one.
-=x=-=x=-=x=-=x=-=x=-=x=-=x=-
Looking Deeper at the Rebound
I want to take a deeper look at today's rally from the morning dip. The timing didn't make much sense as I couldn't find any discernable catalyst to reverse the morning selling. The reverse happened around 11:30, two hours after the positive employment data hit the market. The reversal was also at a very odd round 12,400 for the Nasdaq.
The below chart is the intraday 15m chart and the thing that sticks out is the contrast of volume in the morning selling vs the volume as investors came in to buy the dip. This would indicate that larger institutions were distributing in the morning, but a smaller number of investors were accumulating in the afternoon. In fact, the Volume Weighted Average Price for the day did not regain positive territory.
The response is to not get overly optimistic about the afternoon rally. Keep a cautious eye on what's happening below the surface.
-=x=-=x=-=x=-=x=-=x=-=x=-=x=-
Wrap-up
It's always nice to see a positive gain in the market. But there are still several tests that I'd like to see the index pass before getting more optimistic about a continued rally. First, I want to see higher volume during accumulation than I see during distribution. Second, the index needs to climb back above the 21d EMA to show its moving toward higher prices. Finally, I'd like the see the index make a higher weekly high and a higher weekly low to show a solid uptrend.
Based on the daily chart, I'll set an expectation for sideways or higher on Monday. I think there is reason for caution here, but also don't want to be overly bearish or overly bullish and miss what's going on.
I'll include this quote again from @MichaelGLamothe on twitter as its a good reminder to me:
"I think it’s good to have a thesis about which way the market is going to move. The problem comes when we become too attached to it and want to be proven right.
There’s tons of great reasons why the market will collapse & why it’ll blast off.
Be open/ready for anything."
Keep watching how stocks in your watchlist are performing compared to the movements in the market. The ones that have good relative strength are likely to be the ones to rally the most once the market resumes an uptrend.
Stay healthy and trade safe!

Measuring Corrections on Nasdaq (IXIC) in last 5 yrsHere you can see all significant corrections in the last 5 years on Nasdaq (IXIC).
My idea was to analyse how long they last, in what % do they fall and long it takes to recover.


$IXIC $COMPQ - Updated, Keeping MA50 as Baseline 12525 Is now the main support area.
Following Nov and Oct 2020, it is now 5% below MA50.
Let's hope for reversal from this point.

position in the same direction as the market55 days moving average is support but then it beats to 26 days moving average resistance and the slide will continue to 99 days moving average. the best point for a long position is on the 99 days moving average. after that 55 days moving average acts like resistance.

Bear SeasonIXIC
I went Bear today and going Big Bear tomorrow - Purchasing a variety of puts and couple calls on inverse ETFs.
Example: QQQJ $31p 19Mar


Daily Market Update for 3/4Trend lines drawn from the 2/16 ATH (13d), 2/26 (5d) and today 3/4 (1d).
Ideas always welcome in the comments. Errors will be amended as comments on TradingView or corrected inline in my blog.
-=x=-=x=-=x=-=x=-=x=-=x=-=x=-
Thursday, March 4, 2021
Facts: -2.11%, Volume higher, Closing range: 33%, Body: 45%
Good: Support at 12,550 area
Bad: Rejected at 13,000, new low for year
Highs/Lows: Lower high, lower low
Candle: Red body in center of candle with upper and lower wicks from choppy session
Advance/Decline: Over seven declining stocks for every advancing stock
Indexes: SPX (-1.34%), DJI (-1.11%), RUT (-2.76%), VIX (+7.12%)
Sectors: Energy (XLE +2.39%) was the only sector with gains. Consumer Discretionary (XLY -2.12%) and Technology (XLK -2.21%) were bottom.
Expectation: Lower
-=x=-=x=-=x=-=x=-=x=-=x=-=x=-
Market Overview
The sky is not falling. But the market is! It can be confusing to see the news of reopening of economies around the US and world, positive signs of economic recovery, and yet to have the market be correcting at the same time. Thursday continued the market slide, caused by investor's fears that the economy will recover too fast and inflation will take off beyond the desired 2% that the fed targets, impacting negatively the valuations of mega-caps and growth stocks.
The Nasdaq closed down another -2.11% on much more volume than the previous two sessions. The closing range was a little better at 33%, but still not great. The 45% red body sits in the middle of the candle with an upper wick created by a morning rally to 13,000 and a lower wick created by the afternoon dip to 12,550. The support at 12,550 was expected, but may be temporary. There were over seven declining stocks for every advancing stock.
The Russell 2000 (RUT) had the worst day as small cap stocks were sold off heavily. Relative to the other indexes, the small caps had not been impacted as much until today. The reckoning came as investors looked for more places to reduce exposure. The S&P 500 (SPX) and Dow Jones Industrial average (DJI) also ended the day with declines as almost every segment and sector was hit with losses except Energy.
The VIX volatility index continues to rise with a 7.12% gain today.
Energy (XLE +2.39%) was the only sector with gains as OPEC decided to keep production steady, causing crude oil prices to advance. Consumer Discretionary (XLY -2.12%) and Technology (XLK -2.21%) were bottom for another day.
-=x=-=x=-=x=-=x=-=x=-=x=-=x=-
Economic Indicators
The US Dollar (DXY) advanced another +0.75%. That’s the highest level since November and is another factor on the valuations of large multi-national companies that dominate the indexes and are impacted by a stronger dollar. The stronger dollar makes exports more expensive and also devalues foreign subsidiary revenues as it's repatriated for reporting.
Yields spikes again as US 30y and 10y treasury bonds. The 2y are also gained for the day. Comments by Jerome Powell were not enough to convince investors that inflation would remain under control, causing another sell-off in the bond market.
High Yield Corporate Bonds (HYG) and Investment Grade Corporate Bond (LQD) prices both dropped for another day.
Silver (SILVER) and Gold (GOLD) both declined. Crude Oil (CRUDEOIL1!) advanced on news that OPEC would keep production at current levels. Timber (WOOD) declined. Copper (COPPER1!) and Aluminum (ALI1!) both declined.
-=x=-=x=-=x=-=x=-=x=-=x=-=x=-
Investor Sentiment
The put/call ratio rose to 0.803. The put/call ratio (PCCE) is a contrarian indicator that shows overly bullish or overly bearish investor behavior. The 0.7 level is considered normal. As it approaches 0.60 (overly bullish) and below, watch for a possible pullback in the market.
The CNN Fear & Greed index moved slightly into the fear level.
The NAAIM Exposure Index dropped to 65.37 as money managers reduce positions in the market.
-=x=-=x=-=x=-=x=-=x=-=x=-=x=-
Market Leaders
Of the four big mega-caps, only Alphabet (GOOGL) ended the day with gains, advancing +1.12% and closing back above the 21d EMA. Apple (AAPL), Microsoft (MSFT) and Amazon (AMZN) all declined for the day and are trading below both the 21d EMA and the 50d MA. The decline of these mega-caps will continue to pull the indexes down and influence overall market sentiment.
Exxon Mobile (XOM), Alphabet, Chevron (CVX) and Facebook (FB) were the top performing mega-caps. Tesla (TSLA), Taiwan Semiconductor (TSM), ASML Holding (ASML) and PayPal (PYPL) were at the bottom of the list. The energy stocks had a good day on the OPEC news. It's not clear to me why mega-caps in the Communication sector did well today.
Only a few of the growth stocks tracked by the daily update had gains. Palantir (PLTR) gained 4.83%, possibly driven by retail trading. Moderna (MRNA) and Zoom Video (ZM) also ended the day with gains. Ehang Holdings dropped another -15.22% and is now almost 75% off its high set on 2/12.
-=x=-=x=-=x=-=x=-=x=-=x=-=x=-
Looking ahead
More employment data will be released in the morning. Today's data was slightly on the positive side but did not seem to impress investors.
Big Lots (BIG) will report earnings before the market opens in the morning.
-=x=-=x=-=x=-=x=-=x=-=x=-=x=-
Trends, Support and Resistance
The trend-line from the 2/16 ATH is pointing to a +1.53% gain for tomorrow. The five-day trend line points to a +0.86% gain.
The last three days have seen a fairly consistent angle of descent in prices. If the one-day trend continues, that will mean a -3.26% decline tomorrow.
The index broke through the 13,000 support area and tested the 12,550 area that also held in an early January dip. If it passes that area, the next support area is 12,250.
Yesterday, I showed the head and shoulders pattern on the Nasdaq chart. This pattern represents an attempt to move back to new highs that was rejected at a previous resistance point. Typically the height of the head is measured to determine the potential move downward that will occur as the price breaks below the neck line. The neck line was broken today and the measured move points to a previous support area around 11,800 - 12,000.
That likely would not happen in a straight line. The reason to watch for it is not to overreact to bounces along the way. For example, it would not be unexpected for tomorrow to have gains in the index and then have a further downward move on Monday. Wait for your market rules to kick in, such as regaining the 21d EMA on higher volume.
-=x=-=x=-=x=-=x=-=x=-=x=-=x=-
Wrap-up
The Nasdaq is in official correction territory now with the close being 10% below the all-time high. The other major indexes have a bit to go for the official mark, but are also reacting to an overwhelming amount of selling pressure. There is a general sense that this is not over and selling could continue into next week or longer.
However, I'll quote @MichaelGLamothe on twitter:
"I think it’s good to have a thesis about which way the market is going to move. The problem comes when we become too attached to it and want to be proven right.
There’s tons of great reasons why the market will collapse & why it’ll blast off.
Be open/ready for anything."
Keep engaged. Work on your watchlist, filling it with stocks that are doing better relative to other stocks, even in a decline. Many of those stocks will be the best opportunities when the market finds a bottom and moves up again.
Stay healthy and trade safe!

Reversal target in sight? The current bull run is still valid but based on a few technical indicators we may see some more price action to the downside before a continuation. There are several technical catalysts that may converge near or at the reversal target. Previous daily support, median line support, EMA convergence, and RSI hitting oversold (30).
Momentum – While price makes a higher high from Jan to Feb, a bearish divergence occurs as the RSI makes a lower high, indicating a change in momentum foreshadowing the current pullback. As the RSI falls we see it break through the first key support level, tries to correct, and gets rejected by the midline (50) to then continue the downtrend. As RSI breaks the second key level it tries to break back through to the upside and fails. Judging by the EOD price action on Friday we can assume price rejection was successful and will continue to the downside. RSI is approaching oversold which is a prime area for a reversal in momentum.
Trend – During the current bull run, we see the 12EMA converge on the 50EMA twice but never cross, indicating a strong uptrend. Despite the current price action, the uptrend remains intact as the 12EMA is converging on the 50EMA again but has not crossed. The 12EMA still has more room to the downside before finding support near the 50EMA. The current spread between the EMAs is approx. 2.3%, which is the distance from Friday's low to the lower median line.
Chart Pattern – Price is trading in an ascending channel and attempted to test the upper median line, but was rejected initiating the current downtrend. Price is approaching the lower median line where support was confirmed by Sept, Oct, and Nov lows. Price holding the lower median line and breaking back out of the demand zone may be confirmation of a reversal back towards Jan and Feb highs.
Support and Resistance – Price is approaching the upper part of the demand zone set by Dec highs and Jan Lows. If price can hold in or above the demand zone, that is a strong indicator bears are losing steam, and bulls may regain control soon.
What do you think about this target for a potential reversal?
Any comments or critiques would be appreciated!
This idea is for discussion purposes only and is not financial advice.


NASDAQ 3/4/2021NAS is going through a correction I believe. If Powell can help NAS close over 12,947 I think we see better days.
If not
12,697
12,536
are the next supports and can be a blood bath


Nasdaq looks bearish for a few months. The Dow and S&P will recover too. Fed will most likely bail us out so it doesn’t last all year. Kicking the can down the road again.
