KBWB eyes on $65.58: Golden Genesis Fib for bulls to BreakKBWB trying to resume uptrend but hit a Golden Genesis fib.
Looking for a Dip-to-Fib below or Break-n-Retest to enter.
There is another relevant fib just above so will be tough.
Key stats
About Invesco KBW Bank ETF
Home page
Inception date
Nov 1, 2011
Structure
Open-Ended Fund
Replication method
Physical
Dividend treatment
Distributes
Distribution tax treatment
Qualified dividends
Income tax type
Capital Gains
Max ST capital gains rate
39.60%
Max LT capital gains rate
20.00%
Primary advisor
Invesco Capital Management LLC
Distributor
Invesco Distributors, Inc.
KBWB provides good exposure to the broad US banking market. Its portfolio includes large national money centers, regional banks and thrift institutions that are traded in the US. An index committee determines the funds holdings, while attempting to maintain a market-like exposure. KBWB uses a capped, modified market-cap-weighting strategy that comes close to matching the top-heavy nature of the segment. By industry, the fund strays a bit by including investment management & fund operators, and firms from other industries. Still, KBWB is a nice proxy for the broad industry. The index is rebalanced and reconstituted on a quarterly basis.
Related funds
Classification
What's in the fund
Exposure type
Finance
Stock breakdown by region
Top 10 holdings

Trouble will find Banks in 2025This is another case in point:
Entry Short: 65.10
Exit: 42
Time: By July 2025
All the best.
Marketpanda
Disclaimer: The information provided is for general informational and educational purposes only, and does not constitute financial, investment, or legal advice. None of the content shared shou

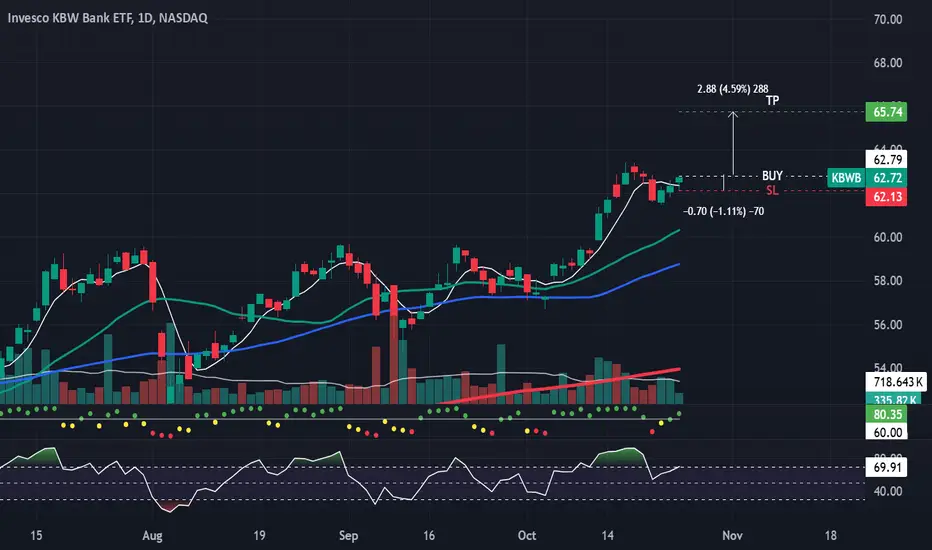
New Setup: KBWBKBWB: I have a green setup signal(dot Indictor). It has an good risk-to-reward ratio(RR:). I'm looking to enter long near the close of the day if the stock can manage to CLOSE above the last candle highs(white line). If triggered, I will then place a stop-loss below(SL) and a price target above it(T
KBWB 2H 2023, 1D Chart Nasty head and shoulders on the KBWB bank ETF.
This is contradictory to all soft landing narratives. Support broken, heading toward the red zone.

When Fear Reigns Banking Majors GainIn times of crisis, investors rush to safety. When risk shows in places of safety, bank runs begin. One's pain is someone else's gain. Silicon Valley Bank (SVB) & Signature Banks' combined assets at $300 billion is witnessing a flight to safety.
At $300 billion, it is trivial relative to $23 tr

KBWB ShortMost likely now the prices are in the final fifth wave of the downward movement.
The first downside target is 50.90. The final target is 45.60


$KBWB "Bottom Triangle" chart pattern formed on Invesco KBW Bank ETF (KBWB:NASDAQ). This bullish signal indicates that the stock price may rise from the close of $40.89 to the range of $57.00 - $61.00. The pattern formed over 119 days which is roughly the period of time in which the target price range ma

See all ideas
Summarizing what the indicators are suggesting.
Oscillators
Neutral
SellBuy
Strong sellStrong buy
Strong sellSellNeutralBuyStrong buy
Oscillators
Neutral
SellBuy
Strong sellStrong buy
Strong sellSellNeutralBuyStrong buy
Summary
Neutral
SellBuy
Strong sellStrong buy
Strong sellSellNeutralBuyStrong buy
Summary
Neutral
SellBuy
Strong sellStrong buy
Strong sellSellNeutralBuyStrong buy
Summary
Neutral
SellBuy
Strong sellStrong buy
Strong sellSellNeutralBuyStrong buy
Moving Averages
Neutral
SellBuy
Strong sellStrong buy
Strong sellSellNeutralBuyStrong buy
Moving Averages
Neutral
SellBuy
Strong sellStrong buy
Strong sellSellNeutralBuyStrong buy
Displays a symbol's price movements over previous years to identify recurring trends.
Frequently Asked Questions
An exchange-traded fund (ETF) is a collection of assets (stocks, bonds, commodities, etc.) that track an underlying index and can be bought on an exchange like individual stocks.
KBWB trades at 75.02 USD today, its price has risen 0.63% in the past 24 hours. Track more dynamics on KBWB price chart.
KBWB net asset value is 75.01 today — it's risen 5.63% over the past month. NAV represents the total value of the fund's assets less liabilities and serves as a gauge of the fund's performance.
KBWB assets under management is 4.77 B USD. AUM is an important metric as it reflects the fund's size and can serve as a gauge of how successful the fund is in attracting investors, which, in its turn, can influence decision-making.
KBWB price has risen by 8.07% over the last month, and its yearly performance shows a 29.48% increase. See more dynamics on KBWB price chart.
NAV returns, another gauge of an ETF dynamics, have risen by 5.63% over the last month, showed a 25.70% increase in three-month performance and has increased by 32.95% in a year.
NAV returns, another gauge of an ETF dynamics, have risen by 5.63% over the last month, showed a 25.70% increase in three-month performance and has increased by 32.95% in a year.
KBWB fund flows account for 2.39 B USD (1 year). Many traders use this metric to get insight into investors' sentiment and evaluate whether it's time to buy or sell the fund.
Since ETFs work like an individual stock, they can be bought and sold on exchanges (e.g. NASDAQ, NYSE, EURONEXT). As it happens with stocks, you need to select a brokerage to access trading. Explore our list of available brokers to find the one to help execute your strategies. Don't forget to do your research before getting to trading. Explore ETFs metrics in our ETF screener to find a reliable opportunity.
KBWB invests in stocks. See more details in our Analysis section.
KBWB expense ratio is 0.35%. It's an important metric for helping traders understand the fund's operating costs relative to assets and how expensive it would be to hold the fund.
No, KBWB isn't leveraged, meaning it doesn't use borrowings or financial derivatives to magnify the performance of the underlying assets or index it follows.
In some ways, ETFs are safe investments, but in a broader sense, they're not safer than any other asset, so it's crucial to analyze a fund before investing. But if your research gives a vague answer, you can always refer to technical analysis.
Today, KBWB technical analysis shows the buy rating and its 1-week rating is buy. Since market conditions are prone to changes, it's worth looking a bit further into the future — according to the 1-month rating KBWB shows the strong buy signal. See more of KBWB technicals for a more comprehensive analysis.
Today, KBWB technical analysis shows the buy rating and its 1-week rating is buy. Since market conditions are prone to changes, it's worth looking a bit further into the future — according to the 1-month rating KBWB shows the strong buy signal. See more of KBWB technicals for a more comprehensive analysis.
Yes, KBWB pays dividends to its holders with the dividend yield of 2.15%.
KBWB trades at a premium (0.01%).
Premium/discount to NAV expresses the difference between the ETF’s price and its NAV value. A positive percentage indicates a premium, meaning the ETF trades at a higher price than the calculated NAV. Conversely, a negative percentage indicates a discount, suggesting the ETF trades at a lower price than NAV.
Premium/discount to NAV expresses the difference between the ETF’s price and its NAV value. A positive percentage indicates a premium, meaning the ETF trades at a higher price than the calculated NAV. Conversely, a negative percentage indicates a discount, suggesting the ETF trades at a lower price than NAV.
KBWB shares are issued by Invesco Ltd.
KBWB follows the KBW Nasdaq Bank Index. ETFs usually track some benchmark seeking to replicate its performance and guide asset selection and objectives.
The fund started trading on Nov 1, 2011.
The fund's management style is passive, meaning it's aiming to replicate the performance of the underlying index by holding assets in the same proportions as the index. The goal is to match the index's returns.