LOCO trade ideas
LOCO - TrendingLOCO's decline had been flattening out in the past few months and the 1st hint that the worst could be over was on 13 October when it gapped up 14% on huge volume. Not long later it went into a sideway consolidation for nearly 3 weeks before staging another strong break out of this consolidation last Friday on earnings beat.
The stock is now above it's 200 day moving average, clearly the trend is up now. Any pullback or consolidation in the near term would be opportunity to stake, with initial stop loss just slightly below last Thursday's pivot low @ 9.65.
Expect some pullbacks/consolidation as it test resistences on it's way up. Take partial profits and/or trail stops up at intervals.
Disclaimer: Just my 2 cents and not a trade advice. Kindly do your own due diligence and trade according to your own risk tolerance and don't forget that money management is important! Take care and Good Luck!
$LOCO special dividend - $1.50LOCO is supply hunting, since the announcement of the special dividend. $16.70 & 11.72 are where supplies are. Depending on how you trade, you can be a directional trade and be long, or if you're just interested in the dividend here is a strategy below to hedge your risk.
The strategy requires a minimum of buying 100 shares, and additional positions need to be in increments of 100 shares -
Buy 100 shares
(-1) At the money calls
(+1) at the money puts
In the example above, your call/put options should be free because the call would have high IV and the credit would cover the cost buying the put.
100 shares x 1.50 (dividend) = $150
each share at the moment is = $11
LOCO 1D TRIANGLE BREAKOUT LONG Triangle are repeatable trading chart patterns.
Triangles are consolidation chart patterns that can breakout either direction.
Each chart pattern will have defining trendlines of the support/resistance levels creating the pattern.
What ever time frame you are trading this chart pattern, wait for a candle close outside of the trendline in the direction of the breakout candle. (Our time frame preference is the Daily chart).
Add volume indicator - Volume is the amount of $ that went into a particular candle or in Forex the # of trades that took place.
Add ATR indicator - Volatility is the amount of price movement that occurred. Use the ATR to measure the price movement.
When you see descending Volume bars and descending ATR line (which indicates volatility) this shows
a dis-interest in traders to invest in this pair creating consolidation which creates the chart pattern.
Trade Management after there is a breakout candle close.
1) Stop-Loss = 1.5 X ATR
1st Target = 1 X ATR
2) 1/2 off at 1st Target for profit
Move Stop-Loss to break-even
on remainder and let profit run
3) If, after entry, the candle closes
back inside the Triangle,
Close for a loss
4) No TP on 2nd trade – letting profit run and adjusting SL to follow price.
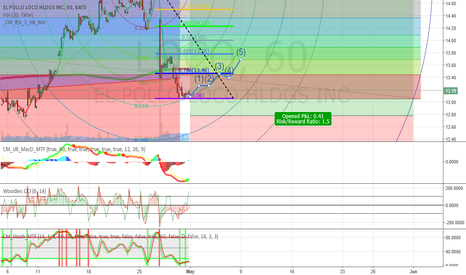
Loco long next monthI'm seeing a set up for a bull run.
Trend lines have been upward slanted the last few months and is still be tested (currently we are on/around the median).
Fibonacci resistance/support lines are being tested too.
I'm thinking either in pre-hours, or early hours after opening the price very well might fall due to exterior motives (SPY tanking); but I don't think it will go below the previous support of 12.80. If it does, it will bounce on it back into a bull Price Action.
BB squeeze on LOCOI do like this trade a lot. There is some "interesting" support from early 2015 which LOCO could pause at for a bit. Don't be chicken to take this trade though. Nice squeeze, there is a gap down. Likely going to play this with shares because options do not move that well on LOCO...
Momentum based SMIIO Indicator This is a momentum based indicator set up using Anne-Marie Baiynd's settings. I have converted the "signal line" to a histogram to make it easier to read the indicator and have found it much more reliable than the standard Mac D.
You will notice your "buy" is confirmed when the indicator line passes up through the zero line and volume is passing through its moving average. The indicator triggers a "sell" when it passes the signal on down through the zero line.
More information can be found in the link below.
Thanks go out to Lazy Bear for coding this and his work in this community is much appreciated.
pastebin.com
www.youtube.com


