LIGHTBRIDGE BREAKING out from a DOUBLE BOTTOMDYOR on the fundamentals.
This idea share is solely based on the chart.
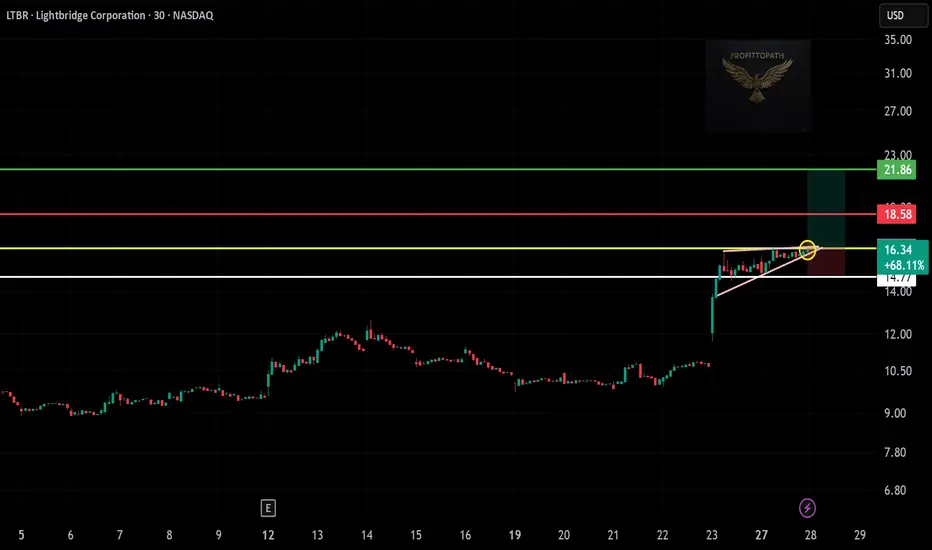
Which exhibits a beautiful double bottom breakout.
LTBR trade ideas

LTBR Long Trade Setup – Eyeing the Breakout!🚀
✅ Trade Type: Long
🕒 Timeframe: 30-Minute
🎯 Entry Zone:
$16.34 (Current breakout level after consolidation)
🔻 Stop-Loss (SL):
$14.77
Smartly placed below the recent support and ascending triangle base
🎯 Target Zones:
TP1: $18.58 (Red line – intermediate resistance)
TP2: $21.86 (Green line – extended move target / supply zone)
📊 Risk-Reward Ratio:
Strong R:R (≈ 1:2.5 or more)
🔍 Chart Analysis Notes:
Ascending triangle pattern with a tight consolidation near resistance
Strong bullish move prior to consolidation indicates buyer control
Volume is healthy; price respecting trendline
Yellow zone is likely a prior resistance flip or decision level
📌 Pro Tips:
Watch volume spike confirmation on breakout above $16.50-$16.70.
Trailing stop using ATR 1.23 is a smart way to lock in profits.
Take partial profit near $18.58, especially if momentum weakens.

LTBR: GOOD DEALLTBR: Do you believe in the future!
One day, you will realize that in the market, opportunities are infinite — only your capital is limited.
.
US STOCKS- WALL STREET DREAM- LET'S THE MARKET SPEAK!

Lightbridge (LTBR) – Daily Chart Analysis As of March 28, 2025, Lightbridge (NASDAQ: LTBR) is trading at $7.80, down -3.07% on the session with a recent test of critical confluence support. Price has lost near-term momentum and is currently sitting near a key inflection zone. The setup presents a decision point where bulls must defend structural levels to avoid deeper continuation to the downside.
Technical Structure Overview
Current Price: $7.80
Recent Rejection Zone: $10.17 – $11.96
Support Levels Below:
$7.73 (current test area, horizontal support)
$6.82 (local structural shelf)
$5.60 – $4.45 (wider demand zone)
Sub-4 range includes prior basing levels: $3.70 / $3.03 / $2.53
Gann Fan Overlay:
Price has broken below the 1/1 and 1/2 fans and is currently hovering near 2/1 and 3/1 levels.
Breakdown below this fan cluster implies increasing downside risk and loss of geometric support.
Volume Profile:
Thin participation below $7.70 suggests risk of accelerated drop if price loses $7.73–$6.82.
Visible volume nodes exist below $6.00, reinforcing that support must hold above.
Momentum Indicators
RSI+
Currently flat just below the midline (~41.49), signaling loss of bullish momentum.
No divergence present; no confirmation of immediate reversal.
WaveTrend 3D
Bearish crossover confirmed and histogram remains negative.
Signal line trending lower, mirroring December’s breakdown structure.
Volume Buoyancy
Curve is fading with no current lift, showing decreasing underlying volume strength.
Momentum is significantly weaker compared to the January rally setup.
Trade Scenarios
Scenario 1: Support Reclaim and Reversal
Trigger: Reclaim and close above $7.80–$8.00 zone with increasing volume.
Confirmation: RSI+ turns up through 50; WaveTrend flips bullish; Volume Buoyancy curves upward.
Target 1: $8.77 (first resistance)
Target 2: $10.17–$11.96 (volume cluster + prior rejection zone)
Invalidation: Close below $7.73 with momentum confirming breakdown
Scenario 2: Breakdown Toward Lower Supports
Trigger: Clean daily close below $7.73 on rising volume
Confirmation: Continuation of negative WaveTrend + buoyancy deterioration
Target 1: $6.82 (local shelf)
Target 2: $5.60, then $4.45
Risk: Accelerated downside if $6.82 fails—volume is thin below this region
Scenario 3: Prolonged Base Building
Structure: Sideways chop between $6.82 and $8.77 for an extended period
Implication: Market digesting prior move, waiting on catalyst
Setup: Range trading opportunities until directional conviction emerges
Summary
LTBR is perched at a critical confluence of structure, Gann angles, and volume support. The failure to hold the $7.73–$7.80 area could accelerate downside into less defended territory. All three momentum indicators are currently bearish or flat, offering no immediate reversal confirmation.
Price is now testing prior base-building zones. This is a key spot where bulls must step in, or the next leg down toward $6.82 and $5.60 becomes increasingly probable.

Giant Ascending Triangle-LTBRLTBR seems to have formed a 4 year bottoming pattern which seems to be imminently broken
You can view this strange bottoming and reversal in the form of the consolation drawn on the chart

Long Trade Setup Breakdown for Lightbridge Corporation (LTBR) !📊
🔹 Asset: Lightbridge Corporation (LTBR)
🔹 Timeframe: 30-Min Chart
🔹 Setup Type: Bullish Rising Wedge Breakout
🚀 Trade Plan (Long Position):
✅ Entry Zone: $14.60 (Breakout Confirmation)
✅ Stop-Loss (SL): $13.23 (Below Support)
🎯 Take Profit Targets (Long Trade):
📌 TP1: $16.06 (First Resistance)
📌 TP2: $18.03 (Extended Bullish Target)
📊 Risk-Reward Ratio Calculation:
📈 Risk (Stop-Loss Distance):
$14.60 - $13.23 = $1.37
📈 Reward to TP1:
$16.06 - $14.60 = $1.46
💰 Risk-Reward Ratio to TP1: 1:1.1
📈 Reward to TP2:
$18.03 - $14.60 = $3.43
💰 Risk-Reward Ratio to TP2: 1:2.5
🔍 Technical Analysis & Strategy:
📌 Breakout Confirmation: Strong buying momentum above $14.60 signals continuation.
📌 Pattern Formation: Rising Wedge Breakout, suggesting continued bullish movement.
📊 Key Support & Resistance Levels:
🟢 $13.23 (Strong Support / SL Level)
🟡 $14.60 (Breakout Zone / Entry)
🔴 $16.06 (First Profit Target / Resistance)
🟢 $18.03 (Final Target for Momentum Extension)
🚀 Momentum Shift Expected:
If price sustains above $14.60, it could push towards $16.06 and $18.03.
Higher volume breakout would confirm strength in the trend.
🔥 Trade Execution & Risk Management:
📊 Volume Confirmation: Ensure buying volume remains strong after breakout.
📈 Trailing Stop Strategy: If price reaches TP1 ($16.06), move SL to entry ($14.60) to lock in profits.
💰 Partial Profit Booking Strategy:
✔ Take 50% profits at $16.06, let the rest run to $18.03.
✔ Adjust Stop-Loss to Break-even ($14.60) after TP1 is hit.
⚠️ Fake Breakout Risk:
If price drops below $14.60 after breakout, be cautious and watch for a retest before re-entering.
🚀 Final Thoughts:
✔ Bullish Setup – If price holds above $14.60, higher targets are expected.
✔ Momentum Shift Possible – Watch for volume confirmation.
✔ Favorable Risk-Reward Ratio – 1:1.1 to TP1, 1:2.5 to TP2.
💡 Stick to the plan, manage risk, and trade smart! 🚀🏆
🔗 #StockTrading #LTBR #BreakoutTrade #TechnicalAnalysis #MarketTrends #DayTrading #ProfittoPath

LEU(CENTRUS ENERGY) and LTBR (LIGHTBRIDGE) LONG LONG LONGLEU seems to be undergoing a continuation from its prior move months ago, while LTBR seems to have completed a 2 decade reversal pattern and conformation to hold the breakout is key

LTBR (SQUEEZE) for Tuesday October 22 ,2024LTBR had an impressive start to the week, closing 26% higher at $8.83, up by $1.82. The day's trading volume reached 12.31M, significantly surpassing the 30-day average of 1.05M. This surge followed the CEO's optimistic remarks on the growing demand in the nuclear sector, further fueled by the increasing needs for AI and chip power. The CEO also highlighted the product's mobility, which allows mega industries to remotely establish operations, making it an attractive investment for its safety, cost-effectiveness, and speed.
Please note that I am not a professional trader, so any trading decisions you make are at your own risk. I am simply sharing my personal thoughts on potential market movements.

LTBR SQUEEZE for Monday October 21 ,2024"By investing in Lightbridge Corporation (LTBR), a pioneer in advanced nuclear fuel technology, you are essentially 'selling shovels during a gold rush,' tapping into the critical needs of the expanding nuclear energy sector."

Lightbridge Corporation - 50% return incoming?Lightbridge Corporation has repeatedly posted explosive gains when breaking above defined resistance levels. The nuclear fuel technology provider is up 60% over the past two weeks, but analysis suggests there are still more gains to come.

LTBR Golden bullish cross!!!The 50 ema, red line, is about to cross the 200 ema and sma, on the daily. Golding cross baby!!
Stochastics RSI is over bought on the 4 hr and daily, fyi. The ADX is showing the buyers are still strong. The green and blue lines are the anchored V wap. Blue is the middle. I have 2 anchors. The previous high around $12 and the previous low around $2.75

Buying LTBRLTBR is breaking higher this morning. Im buying here as its above the supporting moving averages and starting an uptrend.

$LTBR looking like a great setup once againMade a good profit from the last run. This sure seems like it setting up for another.

LTBR LIGHTBRIDGE CORPORATIONPrice might drop to a major support line
which is around $3.21-3.65 RANGE. If we drop to that level then golden cross is very possible and to
the moon. I have sold my position at $8.77. Waiting for a new entry point


LightBridge Magic ShowChart painting from the early 21st century, artist Maxi Scalibusa. No investment advice or a recommendation to buy or sell any securities. This is entertainment. Start 6.86 USD

In for a potentially parabolic move hereBreakout of the ichimoku cloud on the weekly is a strong indication of a trend reversal. Don't be surprised when this hits $30 very soon


LTBR looking to make quick profits.LTBR I notice has been having a good run up from .80s to 1.06 of now.I have been watching the stock for the last year.It looks like could have a major break out if LTBR can break 1.10s and go to 1.30.Still long term this stock is a dud which there isnt product reaching the market is the 2020s.
