LULU - My favorite chart RIGHT NOW!I will be so happy if this continues to dip and wants to fill the gap at 351/340. This thing is poised to explode and I am scooping it up every chance I get.
DO YOUR OWN RESEARCH and let me know what you think :)
I am excited about this one because I love the company and I love the chart.
Happy Trading :)
LULU trade ideas

LULU, Long, 2H✅ LULU is oversold and has rejected the key resistance at 367.50 five times, indicating strong accumulation. A breakout to the upside is likely.
LONG 🚀
✅ Like and subscribe to never miss a new analysis! ✅

LULU Stock: Breakout Setup with Key Technical SignalsLULU is showing promising signs of a potential breakout, and the technical indicators are lining up nicely for a bullish move.
RSI Oversold Conditions:
The RSI has dipped into an extremely oversold zone, nearly touching critical levels. This oversold condition suggests that the selling pressure may be exhausting, potentially setting the stage for a rebound.
MACD Bullish Crossover:
Adding to the bullish sentiment, a clear MACD bullish crossover has been observed. This crossover typically signals a shift in momentum, bolstering the case for a reversal and subsequent upward move.
Key Price Levels:
Resistance & Breakout Trigger: A move above 391 is crucial. A sustained break above this level could unlock further upside, pushing the stock toward our targets.
Target 1: If the bullish momentum holds, the first target is positioned at 384.35.
Target 2: Should the price successfully cross above 391, the next significant target is around 396.
Bearish Warning Zone: Caution is warranted if LULU falls below 353.75. A breach of this support level could signal a bearish reversal and a change in trend.
In summary, the current setup on LULU presents an intriguing opportunity. With the RSI and MACD aligning to hint at a reversal, traders should watch for a decisive move above 391 to confirm the breakout. However, maintaining discipline is key—if the price slips below 353.75, it may be time to reassess the bullish stance.

LULU: Monitor for Potential Rebound Amidst Competitive Pressures
- Key Insights: Lululemon is facing intensified competition but remains
fundamentally sound. Investors should focus on the company's capacity to
innovate and adapt, particularly with product expansions and marketing
strategies. Monitoring sales trends and upcoming product launches will be
vital indicators for recovery potential.
- Price Targets:
Next week targets are T1=$385, T2=$395.
Stop levels are S1=$355, S2=$350.
This positioning allows for a cautious but optimistic
outlook considering the current competitive environment, as proximity to
support levels suggests a possible bounce-back if LULU can regain market
interest.
- Recent Performance: Recently, Lululemon's stock has seen a downturn in
response to competitive pressures rather than disappointing earnings. This
has led to investor sensitivity, resulting in lower stock performance amidst
a challenging retail climate for athleisure products.
- Expert Analysis: Experts suggest that Lululemon's price decline is more
attributed to market dynamics than internal issues. The stock's recovery
depends greatly on LULU's ability to stay ahead of competition through
innovation and effective marketing strategies. Investors are encouraged to
keep tabs on these developments as sentiment could shift positively with
successful initiatives.
- News Impact: Increased competition has introduced significant market
fluctuations for LULU. The company may need to reassess its approach in
terms of market positioning and consumer engagement. Close observation of
Lululemon's response through new product launches and marketing efforts will
provide insights into its effectiveness in navigating these challenges.

LULU BreakoutLULU currently showing some strength compared to the market.
Price is breaking out from the channel.
I am waiting for the candle close so I can find an entry


Lululemon is Getting Sour. LULUThis is not a perfect harmonic, far from it. The AB bounce is quite high, although mostly in wick, and BCD is only 0.786 of XAB fibtime wise. Nonetheless, vWAP cross happened with the bearish engulfing and Ehlers UltraSmoother is resistant with down going gradient. Stoch/RSI and VZO flipped a while back and %PCT has been progressively dropping and will no doubt flip soon with that bearish candle.

LULU, Short, 2hentry: Current Market Price
take profit: 18.15
stop loss: 19.25
LULU has broken through a resistance level and is now showing signs of a retracement, likely pulling back to retest the broken resistance before potentially continuing lower.
SHORT 🔥
✅ Like and subscribe to never miss a new analysis! ✅

$LULU - U shaped pattern forming on dialing time frame. LULU -Stock making a possible U shaped pattern on daily time frame. Stock has been in a strong trend since reporting earnings. looking for calls as long as $390 holds for a mvoe towards $400 and higher. below $390 support at $386 and $380.

LULU LongAlert set for LULU at 425 for buys. will consider entry based on price action at this level.
Potential S/R swap at 400-415 and .618 FIB retracement at this level.

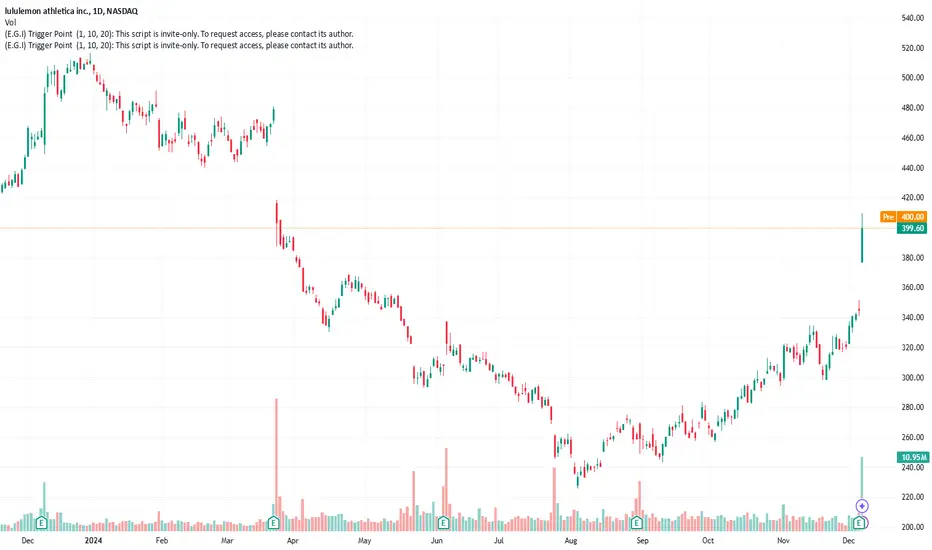
Lululemon set to breakout as bullish sentiment reignsKey Insights: Lululemon's recent price action indicates potential upward
movement as it rebounds from previous lows. With recent trends suggesting a
bullish momentum, investors should look for opportunities to capitalize on
possible breakout conditions around the $400 resistance level. The stock's
current positioning invites longer-term prospects for those willing to
navigate the volatility.
- Price Targets: Based on professional traders' wisdom: Next week targets:
T1=398, T2=405 Stop levels: S1=385, S2=380
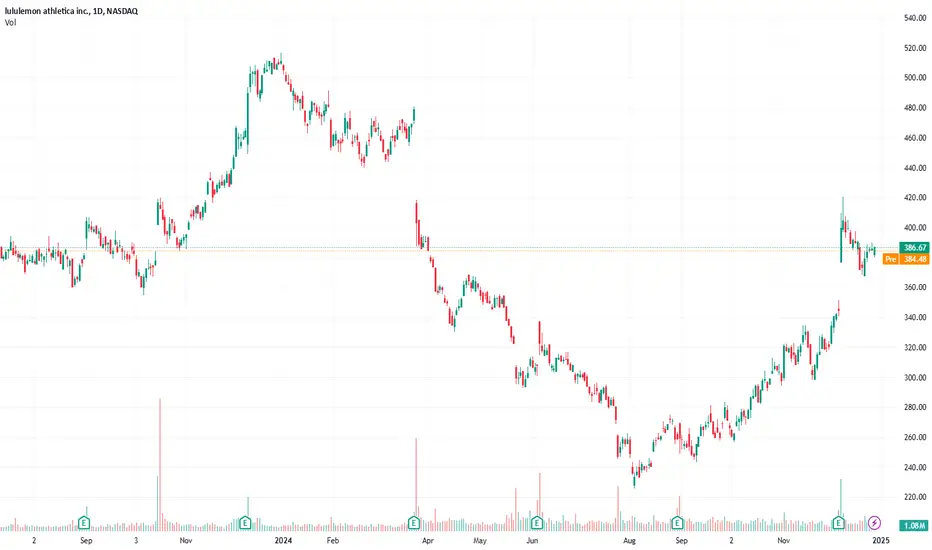
- Recent Performance: Lululemon has shown resilience after significant price
fluctuations, recovering from lows in the $360-370 range to a current market
price of $386.67. The approach to the critical resistance level at $386
suggests a pivotal moment as bullish volume gathers support while attempting
to breach upward.
- Expert Analysis: Analysts express optimism regarding Lululemon's trajectory,
highlighting the consolidation around critical price levels that could lead
to a breakout. Market sentiment is leaning positively as traders speculate
on the stock crossing the resistance threshold at $400, which could invite
further buying interest and an optimistic trend moving forward.
- News Impact: While no specific recent news has emerged, industry trends
indicate a favorable environment for health-focused apparel brands. Investor
attention should remain focused on any developments from Lululemon or
overarching market shifts that could impact consumer sentiment or retail
dynamics, especially as the stock hovers near key resistance levels.
LULU, a stock to watch!Lululemon stock (LULU) has traded down into the $230's for the first time since the COVID-19 Crash of 2020. I believe that LULU is a stock to keep your eye on, for a few reasons.
- The stock is trading at a 20x p/e whereas its historical p/e is in the mid 40's.
- Margins for the company have all been steady, and remain an industry leader.
- Lululemon is still set to see 10% CAGR for EPS in the next 5 years. (consensus)
- The stock is seeing a severe correction, on par with its past decade corrections.
Above is bullish sentiment on LULU, and can be considered the "bull/base case"
Personally, I have not turned bullish on LULU yet, but with the levels it is reaching it has most certainly caught my eye and has been added to my watch list. While the stock is seeing oversold levels, I think the midterm outlook can still remain bearish for Lululemon. Below are reasons why the short/midterm outlook for LULU may not be optimal.
- Weaker forward projections compared to last 5 years.
Though LULU is expecting 10% CAGR EPS for the next 5 years, that is just a fraction of its last 5 year CAGR of 38.55%. While projections are still positive, they have certainly dampened compared to recent years' growth.
- Macroeconomic environment.
Though the economy remains hot/fine for now, there have been warning signs flashing of a rising unemployment figure across the country. With suboptimal economic conditions, the average consumer may cut down on expensive Lululemon clothing.
These Macro conditions may also continue to dampen the economy, which can cause an overall market correction, where LULU would likely follow the sentiment.
Overall, I believe that LULU offers significant reward, but the shorter term horizon is still worrisome for Lululemon and the global economy. Lululemon is a leader in the Retail Trade sector and dominates when it comes to profitability. The stock is definitely one to keep an eye on if it continues to get crushed.
Regarding technicals, I am watching this demand zone around the 200 level. The stock could trend down to this area, and reach close to COVID-19 lows if sentiment does not change. This area could also offer significant R/R for an entry point.
Disclosure: I currently hold no position in LULU stock, and have never been a shareholder.

$LULU - falling wedge breakoutLULU - seeing falling wedge breakout here on daily time frame. looking for calls above $390 for a move towards $400 and higher. Company reported better than expected earnings recently. Stock is decent on indicators.

LULU - Exciting chart and predictable liquidity buildThe story of this chart is definitely bullish and while I am continuing to average into a position of shares here, I do want to identify a confirmation point where we can potentially play some longer-term options and catch the subsequent breakout of the $420 cup/neckline that we've created.
Let's see some confirmations of HTF controlled selling along with LTF controlled buying (in order to get one more pullback to demand at $470/bottom of strong buying continuation.
Happy Trading :)

One Good Trade: LULU Following Other Consumer StocksOther consumer stocks are looking strong right now. LULU is no exception. I think their movement is largely dependent on the federal reserve decision today on rate cuts.

Lululemon (LULU) - Trend Channel Setup with Strong TargetLululemon is consolidating within a descending channel following a strong impulse move (wave iii). The price is currently forming wave iv and respecting support near $371.70. A breakout from this channel could trigger the next leg higher toward the key Fibonacci targets.
Setup Details:
- Entry Zone: ~$390.60
- Stop-Loss: $371.70
- Target 1: $409.96
- Target 2: $449.27
Key Observations:
- Trend remains bullish supported by wave structure.
- EMA ribbons below price indicate bullish momentum support.
- Watch for breakout confirmation above resistance to trigger the trade.
Risk/Reward: Attractive 1:3+ setup. 📊
#LULU #Trading #NASDAQ #StockMarket

LULU Major Trend RetestLULU has been on a huge run since August to recover the majority of the losses from earlier in the year. Now it's all the way back up to the major trendline it broke below earlier this year that started in 2020.
Coming in for the first retest, would expect a rejection of some sort here. Downside target would be around $356, upside is around $450.

LULU SELL ++++ $415 and addI am looking to start a short position in LULU at $415, I would add every $5, its extremely overbought here and can go a little higher on this stent before correcting. We could test $369 in coming weeks and gap fill

Maximize Returns: Consider Long Positions on LULU next weekRecent Performance: Lululemon Athletica Inc. has shown significant strength
recently, reflecting a positive trajectory in the consumer discretionary
sector. The stock is benefiting from an uptick in consumer spending, with
robust sales growth supported by a strong post-pandemic focus on health and
fitness. The company’s performance has been commendable, outperforming many
peers while maintaining brand loyalty and community engagement.
- Key Insights: Investors should note Lululemon's consistent innovation in
product offerings and strategic expansion into both domestic and
international markets. The company’s enhanced e-commerce capabilities and
focus on sustainable practices are critical growth drivers, appealing
particularly to the environmentally-conscious younger audience. The overall
sentiment is to adopt a buying stance as the stock continues to gain
traction.
- Expert Analysis: Market experts maintain a positive outlook, with a consensus
rating leaning towards ‘buy’. Analysts highlight Lululemon's strong brand
equity and innovative product strategy. The company’s solid quarterly
earnings and forward-looking actions position it well within the competitive
retail landscape, fostering confidence in continued growth.
- Price Targets: Based on current analysis, next week targets are set as T1 at
$410 and T2 at $420. Key stop levels are S1 at $375 and S2 at $360. This
placement of targets and stops reflects a conservative yet optimistic
approach to positioning in LULU, aligning with current market dynamics.
- News Impact: Recent developments include Lululemon's quarterly earnings
beating expectations with strong online sales. New product lines and
collaborations have also generated market interest. The company's
international expansion strategy and commitment to sustainability through
recycled materials significantly enhance brand loyalty, making it a
compelling investment option moving forward.
LULU targeting 377-386Price has recovered sharply from an equally sharp pullback which bounced off the 0.382 retracement of the move up from the Oct 03 low. Price seems like it will soon hit the 0.618 retracement of the larger move down from ATHs.

LULU: 377-397 taking profit1. LULU weekly chart within a giant megaphone.
2. Regardless of counting the bounce from the drop, or the extension from the initial rise, 377-397 is the area I will take some profit. Will keep some position to see the next stage pattern.
3. Ideally I want to see some consolidation here. Cup Handle? Or more identifiable wave pattern.

LULU buyingThere is a head and shoulders pattern targeting approximately 439 level. It may reach the target if the company’s results are positive because there is an announcement after the market closes today.

Dark Pool Accumulation Patterns Ahead of EarningsNASDAQ:LULU is working on completion of its long-term bottom. It has good PSHI and has been trending up for a while. The company reports this week. It may gap on earnings news. The steady but slower-paced improvement in price is indicative of Dark Pool accumulation.
