Watchlist 2023-02-02 #META #GOOGL #AAPL #SIRI #LCID #HBISPY had a shallow pullback after the Fed announcement and continued the day will insane bullish momentum. key indicator before the meeting was spy calls and puts 100 points out. Typically before these meetings, pouts have a premium, but yesterday longs had an 0.80 cents premium. Then, after the announcement there was a quick flush that held the key 402 support. After that it was long all day long. Today, now that it’s past the 410 resistance, look for dips in names with high RVOL breaking key resistance, especially semis that were lagging AMD. Next Res is 420.
The META earnings is a huge catalyst for all the tech sector. META is up 30% so it's a no trade for me but others look good at these levels.
GOOGL - If it can hold above 104.60, (Pivot and 200MA) interested in a long. Might have to wait until the momo settles.
AAPL - Gapping over 146.70 pivot and 200MA in anticipation of earning After hours. . Watching these closely today for any pullbacks. The fakeout below 142 PD is a big indication that early longs were flushed out and shorts were trapped.
SIRI - Gapping down on earning anticipation. If we can hold below 5.70 there could be a scalp momo short there.
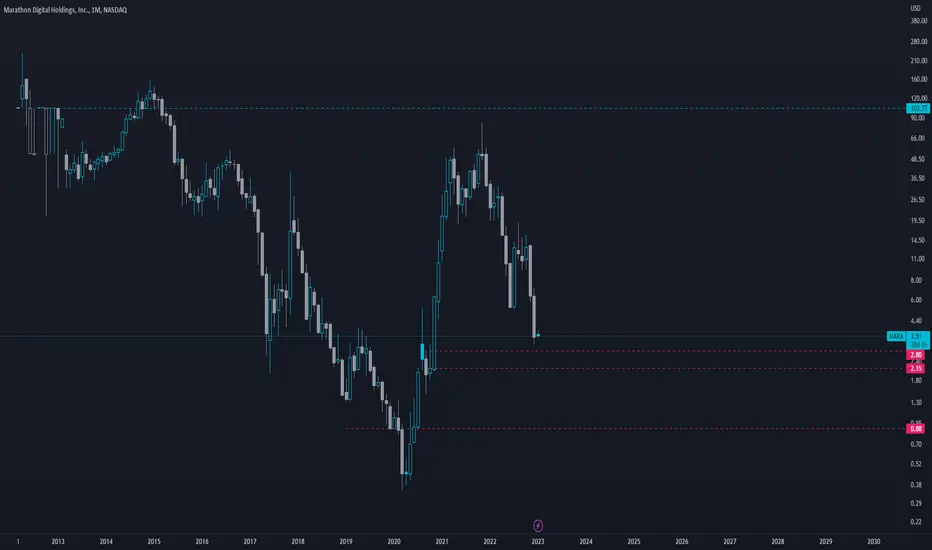
Watching LCID above 12.25, MARA over 8.00, both for daily buy setups
MARA trade ideas

Scouting Hourly Lower Highs on MARAWith the break of the $7.90 premarket (now a gap down open) low we know that daily consolidation is underway. Given that BTC is looking for hourly lower highs and that MARA is trading in kind we can look to MARA to see weakness on any short term bullish attempts.
The most likely outcome here is a lower high under $8.50 which would see short term bulls over extended in a range wherein we will be scouting weakness.
Bears still need to prove themselves so as always we will be managing the stops quite closely.

$MARA this weekMARA and Bitcoin have different patterns but are closely linked, each consolidating to continue its big climb. We hope to see it return above $15 USD this week, stay tuned!

$MARA swing trade 👁🗨*This is not financial advice, so trade at your own risks*
*My team digs deep and finds stocks that are expected to perform well based off multiple confluences*
*Experienced traders understand the uphill battle in timing the market, so instead my team focuses mainly on risk management*
This afternoon my team purchased shares of digital mining bitcoin company Marathon digital $MARA at $8.60 per share. Our take profit is $14. We also have an optional stop loss at $7.75
Our Entry: $8.60
Take Profit: $14
Stop Loss: $7.75
If you want to see more, please like and follow us @SimplyShowMeTheMoney

MARA A-B-C to wave 2I am expecting wave B of 2 here soon and then a 5 wave structure down to C of 2.
Somewhere within that orange target box.
Also notice the volume is decreasing.
Good Luck

Same old songNothing has been change, the bull trend is intact, just people taking profits and buying again

Scouting $MARA ShortRecent strength in BTC & Crypto has resulted in a strong MARA daily breakout. Bitcoin is due for daily consolidation so we will be watching for signs of weakness and a sympathetic decline on related names like MARA.
Caution as we have not yet seen the weakness we need but we are preparing to react.
For continuation bulls need to break $8.75 and see BTC having similar follow through. Watching for the following
1. Periods of weakness and rejection from intra day levels, possibly $8.75
2. Hourly consolidation with significant advance toward the $7.21 support
4. Loss of the hourly uptrend into daily consolidation.

mara up on btc/usd ratio near optimalFib levels show that if if 8.5 is broken, then big gap ups look possible. dollar/btc ratio is the best that it will be or near optimal. btc will be pumped as market realizes this is the time to purchase. mara holds a lot of btc, so its valuation will increase significantly. new gpus from nvda's will also help mining
chart shows descending wedge with obvious bullish momentum and a possible squeeze

MARA - Mother of all Inverted Head & Shoulders (Bear Apocalypse)Found a hidden Inverted Head & Shoulders on MARA long-term chart that will go down in history as "The Great Bear Apocalypse of 2022"
Watch BTC & Crypto charts closely for entry and ride this rocket into the sun
Keep in mind the BTC halving is in spring 2024

MARA take profitsWave 1 looks to be completing. I have set my S/L to $6 and will move it up as the day progress (if possible). I am expecting a correctional wave 2 to around 50% before the next large impulse up.
Good Luck

MARA short term resistance Short term resistance is 4.18 dollars. This is before the 2pm FOMC mins. Not financial advise.
This is very suspicions price action to me, there is no reason why MARA should be up over 20%. Does someone know something we don't?
- BTC and the NASDAQ are not up very much either

Marathon Digital is the futuretotally kidding but thats besides the point, all these blockchain companies should have some support lower once btc finally turns around so they can show profits again, most of them are mining behind the scenes so once they lose all this value therye a decent punt depending on how you look at things. would keep an eye out and start accumulating this sub $1, good lukc traders
MARA Double Bottom at $5.26 support?Will MARA turn around here and begin to climb?
Looking at the price structure $5.26 has been a pivot price range.
Depending on the daily close above $5.26, I expect MARA to perform a double bottom for 2022.
Good Luck

Mara possible break out. Mara: the more conservative approach in my opinion would be to wait for the gap fill below prior to starting to accumulate as price consolidates and hopefully starts to move to the upside.
only for illustration purposes not trading advice.

Mega bull flag!!!The bull flag is there, so, i think we are waiting for the santa rally or today JP with the rates, get ready!

Looking to pick up some $MARAWe have major confluences around that $2-$2.50 mark. It's is the 1.27 fib level, major support and a measured move.

MARA Long Term Fibonacci As crypto continues to consolidate, MARA is back to the June low level of $5.42. This is only a 50% retracement from the Covid lows to the BTC 69k peak. Wherever MARA chooses to bounce, there is a 100% flip that should follow.

MARA heading down to CI am expecting MARA to head down to lower trend support or wick below to create new lows for the year.
I have placed GREEN lines for great targets to LONG.
I do expect BTC to descend also.
Good Luck

a massive 220%i put a magnet 220% up just in case, but technically we went from a falling wedge to a super powerful flag.

You should buy $MARAABC correction ended @ fibonacci 50% and 1.236 fib extension. And we see an impulse from that level. Marathon is a digital asset technology that supports and secures Bitcoin ecosystem. Expect at least 10X return in the next bull run.

DOUBLE BOTTOM?Not sure this time, I think a lot of traders will get in around 5.28, but I think it will fall further to 4.50 area.
If market conditions are favorable, them $11 would be my target.

$MARAToday while almost all of crypto crashed $mara miraculously held up. After TERRIBLE earnings that showed they are burning money and $BTC nosediving somehow this thing was green today. BTC literally broke below 2 year lows and this puppy barely budged. The relative strength to any other crypto related stock or cryptocurrency was absolutely insane. I sense that its being manipulated heavily. Even so the facts are there is no way this thing shouldn't have tanked. While green I added a lot of 11.5 11/25ps. Still have some 11.5 11/18 Ps I bought yesterday. I gave myself more time today just incase somehow this thing rips. There is a huge volume gap below plus a huge volume shelf above that is going to make for some tough resistance to breakthrough. On top of that I think we have awhile before all this FTX mess is settled. Crypto market is spooked with a lot of money is tied up and any trader thinking logically should be very fearful of this space until things become more clear imo. This one is almost so obvious that it makes me nervous I am missing something. Am I missing something?

MARA | Its About that Time | LONGMarathon Digital Holdings, Inc. operates as a digital asset technology company that mines cryptocurrencies with a focus on the blockchain ecosystem and the generation of digital assets in United States. As of December 31, 2021, it had approximately 8,115 bitcoins, which included the 4,794 bitcoins held in the investment fund. The company was formerly known as Marathon Patent Group, Inc. and changed its name to Marathon Digital Holdings, Inc. in February 2021. Marathon Digital Holdings, Inc. was incorporated in 2010 and is headquartered in Las Vegas, Nevada.
