MARA trade ideas

MARA ready to flyMARA has a great setup, probably gap up tomorrow. If it doesn't will look to get some 8/27 calls for a quick swing. PT this week is $39-41.

Elliot Wave correction phase for MARA and another leg up to comeLooks like a picture perfect elliot wave forming for MARA on the daily. Possible correction phase currently and looking for entry around $30 for next leg and final 5th wave up. Let me know what you think.

$MARA some signal$BTC did a massive selloff, probably making a few inside days and break out/down. In the meantime, $MARA gives a weekly sell 13 that its okay-ish looking. Will make a small size put spread just because.

Mara off the recent BTC news$Mara has been hit today from the recent EL salvador news but is making a strong comeback and this could also be a great buying opportunity for some people as they are trying to time this dip. Well here is a dip while whales sold off their positions.

$MARA Analysis & Key Levels$MARA Analysis & Key Levels
No looking good for Bitty today… Still on target from the last post… I think there’s quite a bit more to go…
It might be a long Sept. for MARA
I am not your financial advisor, but I will happily answer questions to the best of my ability but ultimately the risk is on you.
Red = Key levels
Green = resistance
Blue = trendlines
Have fun, y’all!!

MARA Short SqueezeMarathon Digital is a Bitcoin Mining stock with ~18.5% short interest. Stock is primed for a short squeeze, looking for the share price to breakout vs bitcoin price. Targeting a share price that is .15-.20x btc price /100.

Marathon Digital Analysis 04.09.2021Hello Traders,
welcome to this free and educational analysis.
I am going to explain where I think this asset is going to go over the next days/weeks and where I would look for trading opportunities.
If you have any questions or suggestions which asset I should analyse tomorrow, please leave a comment below.
I would also appreciate, if you would smash that like button and help me to create more free analysis like that.
Thank you for watching and I will see you tomorrow!

Crypto - Short MARA Domed House and 3 PeaksIdea for MARA:
- Domed House and 3 Peaks, its a Wyckoffian variation of UT/UTAD and LPSY.
- Bitcoin at "Return to Normal" Phase of classic bubble pattern.
- There are no fundamentals which support the rise in risk assets - especially in crypto, aka "sucker's rally".
GLHF
- DPT

How to profit from short squeeze by swing trading$Mara, expected the price to consolidate the area of 40.51 & 33.75, as we are expecting breakout @40.51 NASDAQ:MARA

MARA is ready to fly???NASDAQ:MARA Refer to EPRAF Indicator, last Friday, MARA broke the resistance (highest price) Trigger Candle (TC). So today MARA looks full of energy to fly to the moon.

$MARA Analysis & Key levels$MARA Analysis & Key levels
I can see MARA maybe pulling back to support (36.27) and then up towards 39.70…
Looks bullish on the bigger timeframes but the smaller timeframes might pull back a little this morning…
Keeping an eye on this one this morning for sure…

mara long setup part 2follow up to the previous setup (view it at the bottom of this text)
mara saw a nice reaction from the last golden zone, and made a push up to that -0.236 algo target
so that's precisely how we're going to play this dip.
buy the 0.618 at $26
sell the -0.236 at $43.50
ps. unfortunately this mara chart isn't as clean as riot and some of the other miners, so i don't feel comfortable playing this any higher than said target.

BTC Teethers to the real market....is there a correlation? In this first of many videos I have gone through a list of 100+ stocks and marked the placement of the teethers and the actual price point at the time I marked them. I will filter down this list to any stock I see a underlying correlation to the price action of the stock. I have used this technique to predict the bottom of bitcoin when it hit $30k and bounced. So basically finding the bottom twice with extreme accuracy. I actually believe I have some Ideas posted showing this bounce. and also some ideas showing where it would go afterwards. Being that bitcoin is above $42k I believe my 6 predictions leading up to it plus the two bounces at the bottom were all correct.
So I had a wild Idea....what if there is some correlation to the real market. A lot of companies are invested in bitcoin these days and a lot of institutional buying is also invested in bitcoin. If algos are trading bitcoin then it would be my belief that there is a correlation to the market and crypto through the algos that are being used. If a major institution is trading btc using its algo, and it is also trading the regular market, it would probably show in the price action in the same way. In just this first video, I think I prove that.
You are welcome to try and recreate what I have done here but I have acquired savant syndrome, I doubt you will see it the same way I do. There really is nothing to what I am doing that is special. I am just analyzing what I see, comparing that to the curve, wyckoff methodology, Candle stick technical analysis, Node analysis, and pattern recognition.
It takes me about 30 mins just to upload a video to Tradingview. So this will be 1 of probably 15 videos over a months time most likely an on going thing after the initial set that covers the first look. I will have to continuously adjust the list of the stocks that are showing some type of correlation to the BTC Teethers. Then Come up with an Ideology of how to interpret which lines are interacting with Price Action on each stock. If there is a Strong Correlation or a slight. Then come up with a test to really see if this stands up as a solid indicator. If anyone would like to help fund this, it would be much appreciated as it would take up 8-12 hours a day for months if not years. Finding early results would be easy but really finding out how this plays our will take months, each stock. Contact me here if you are interested in helping and I will post you in the credits plus give you first hand review of all the findings as I go through them. Thanks for watching.
by iCantw84it
08.17.2021

MARA possible moveMara has had a rough few month but is starting to show power again alongside the rise of Bitcoin. If Bitcoin continues to rise and exceeds 50.000 dollars Mara will have strength to break the major resistance in 39.69 dollars.

looking for re entry 26.5mid Bollingar band : 26.44 per share seems a good entry for long term- am bullish but a lower than 28 entry is way better

MARA finally cleared the cloudMARA finally cleared the 1D cloud that has been bearing down on this stock for months.
Fidelity's announcement that they have 7.4% stake in MARA, that sure helped boost them today.
Will MARA rise higher? totally depends on BTC; however, clearing that cloud with 1D candle sure helps and with a green twist too.
IF BTC pumps MARA will see $40's soon.
$28 seems to be new found lower support, if you can enter below that value, good for you!
Good Luck


Pull Back FishingPossible stop under one of the pocket pivots (green triangle) or under D.
No recommendation.
Cypher pattern is a harmonic pattern and is one of the two patterns I know of that have the 2nd peak higher than the 1st peak. The last leg, or CD leg should land at the .786 of XA (1st leg).
Be safe. MARA will most likely move with the coins and since most of the coins arced, it may be a bumpy ride. This is not always an easy game we play.

MARA breakdown$20 Put for 8-20. Price Target $18-17.50. Breakdown though the IchiMoku. With Bitcoin tanking and the market FUD wouldn’t be surprised to see a coninuation of this to the downside

MARA: Trendy Wyckoff Theory AnalysisI've plotted Wyckoff Theory over MARA. I feel we are currently in Phase E.

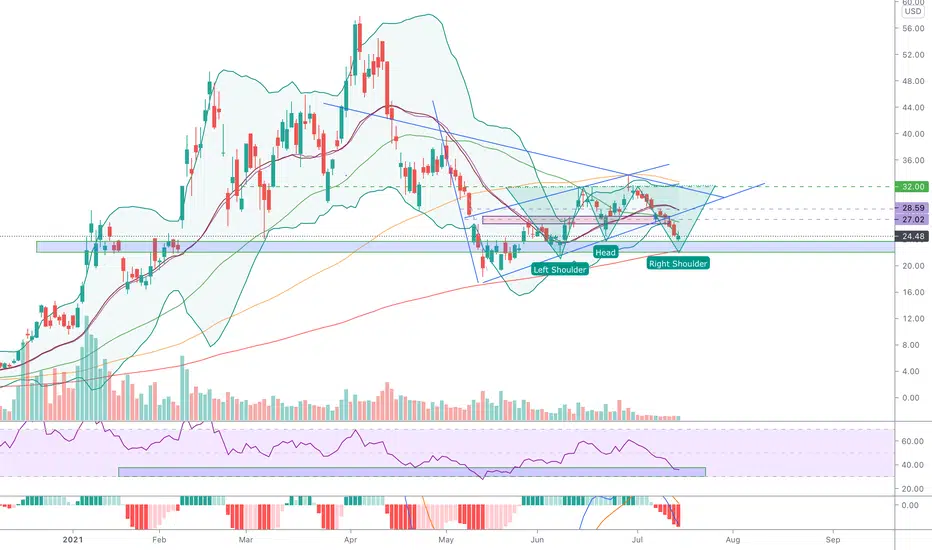
$MARABear flag broke south as expected.. i am still somewhat bearish on this.. something to keep an eye on, this is the strongest demand area for $MARA.. with that being said i would not be surprised to see this come down to tap 200ma only to gain momentum and flip this into an inverse head and shoulders.
MARA CHART SETUP Mara seems to have broken below the channel it was trading at, any chance its a false break or are we going to see a downward trend.
