MESO trade ideas

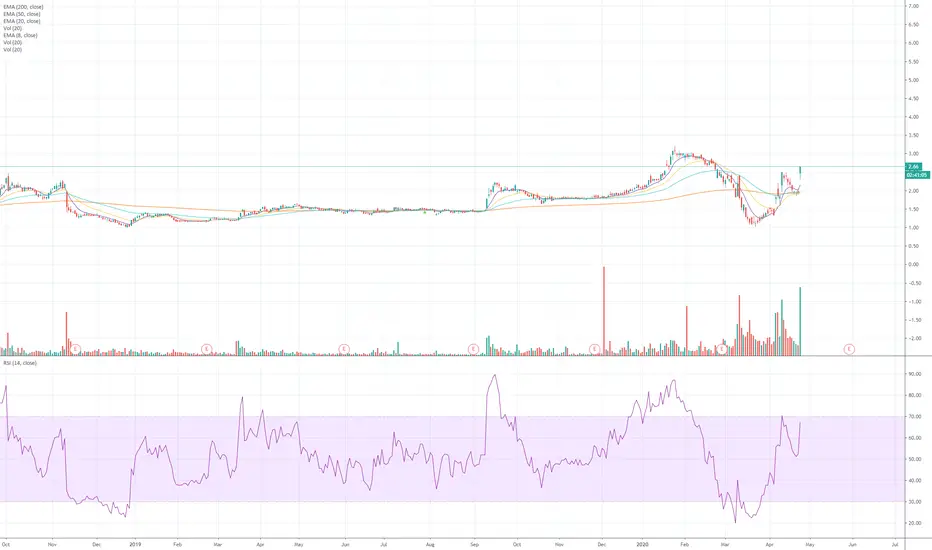
Mesoblast MSB - Greed then Fear in Full Display.Is this fear and greed in full swing. I am long now that the price has crashed like a Boeing Max. Looks to have hit support at bottom trend line.

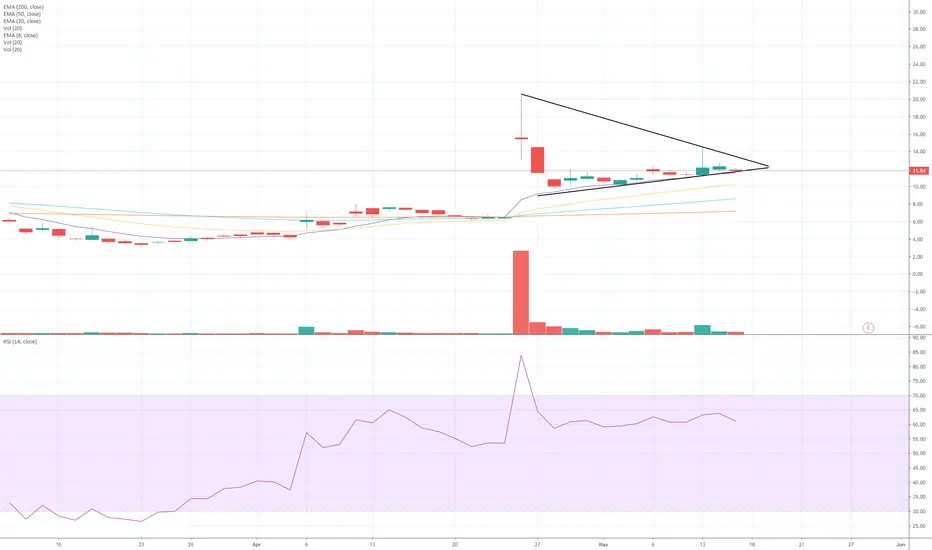
$MSB $MESO decision time says the chart. FDA?If I was a betting man, and thats all this is, I reckon theres a chance of some Phase III results shortly. Chart is well supported and phat like a turkey. See which way it gobbles.

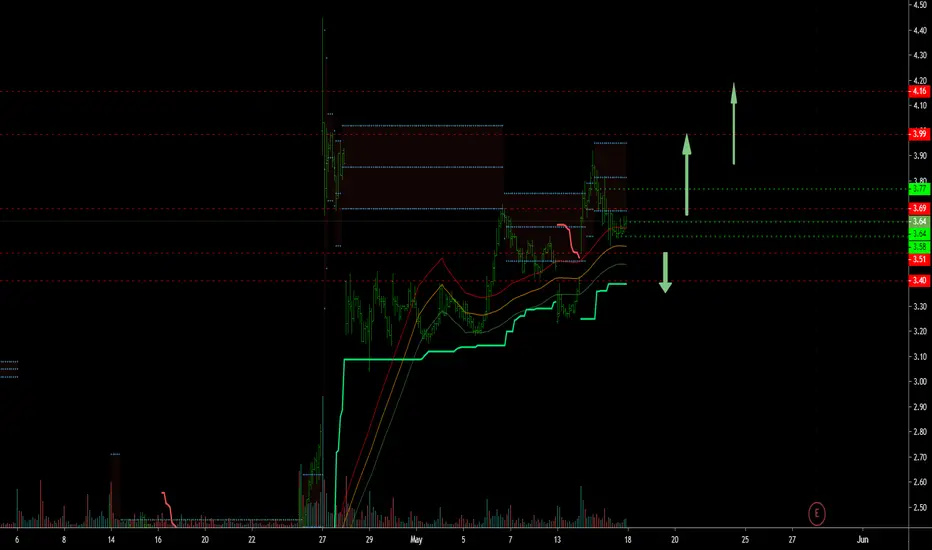
MSB - Price chart analysisShare prices are currently making their way back slowly towards its previous high following a price gap to the upside and a pullback, which saw the price gap filled at 3.70.
The share prices are making progress to the upside with higher highs and higher lows which is a good indication of an uptrend but needs to remain above 3.70 to continue to its next target at around 3.80 and 4.00
MESO Long biasThis stock is approaching a weekly area of demand. Inside the Weekly area of demand, there is a Daily are of demand that you can go long at. use proper risk management if taking this trade. i recommend 1%. If you guys have any financial instruments you guys want me to look at, let me know I'm more then happy to analysis

$MESO $MSB it could go either way.Awesome when a chart reflects reality. Big trial, big hopes = DANGER. Could buy the break or short the break depending on which way it goes and your mindset.
$MBS buy above 3.60 on volumeReally liking the uptrend and respect of the 8 day. Buying 3.6 and pyramiding up to 3.70 and looking for a retest of the initial high around $4.20.


$MSB - buy the bounce off the 8 dayCracking setup on a hot stock. wait for the pullback into your hitting zone, press the button and grab the cash. Thats your job. The other job is to derisk along the way in bios. High risk entertainment can hurt bad.
$MESO $MSB - inside week holding the BGU. The phase 3 trial has begun and will take however long it takes with any positive interim news likely to be announced, on balance this offers great risk reward here. My first target is the close from weekt. Then we'll reevaluate.

MSB buyers opportunity Chart structure and pullback were at nice levels.
overall HTF is bullish ,Ranged for long time momentum change happened ,
LTF shows accumulation phase as shows sellers couldn't get any lower.
await retest don't be fooled fomos buy at a discount please . news events and chart confluence work together .
l except Crypto's , and yes nothing is free in life ! profit targets we can talk about later.

$MSB not sure you can have a BGU not break res. Better today.Buyable Gap Ups are usually associated with a company changing announcement and big volume. MSB trading like a dog in comparison to is US sister shares $MESO but looking good here. Stop below the todays low. And let enjoy the ride. Thanks Tom and Roley.
$MESO red line is the Pre Market trading price. $MSB after a BGU in the Aussie trading hours, this thing is getting some interest in the US pre market. And for some reason US futures have gone green...

$MSB starting to look like a BGUgreat announcement regarding reduction in mortality of severe covid sufferers. Interesting to see how US investors treat this tonight.
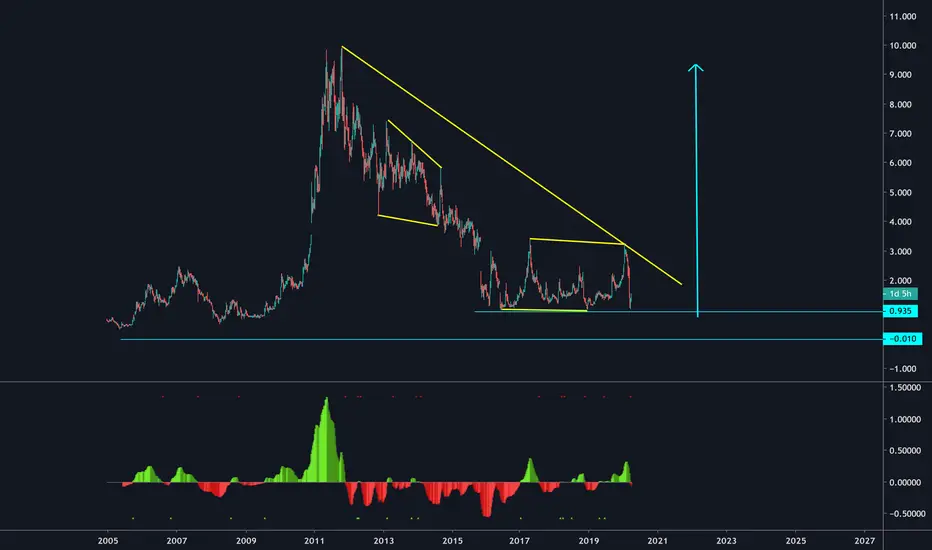
MSB | monthly upside playing out soonhey traders,
short term a little more downside, but when we've broken the low, only looking for upside
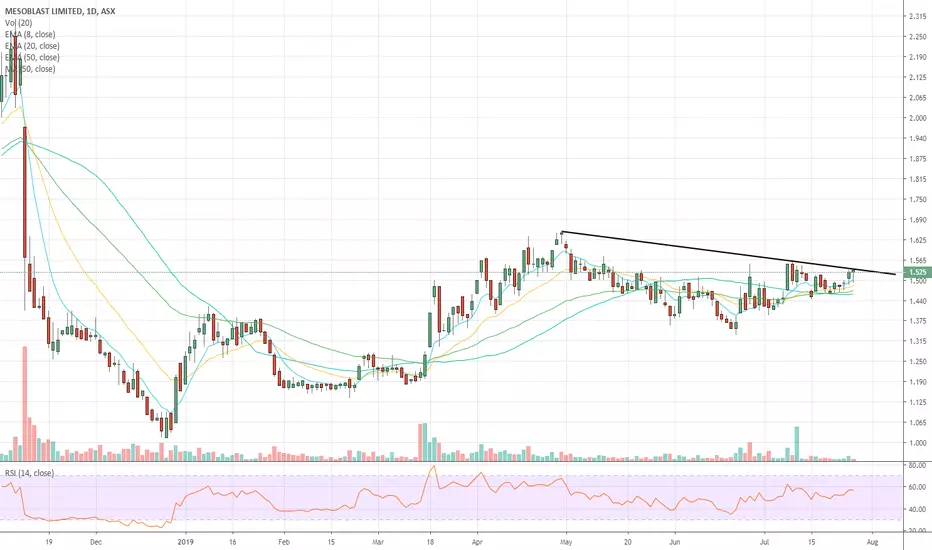
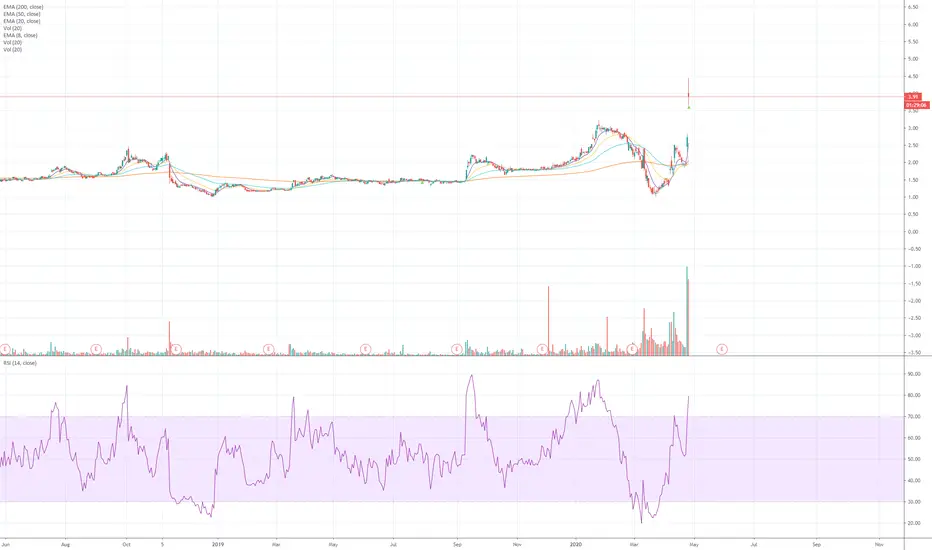
BUY MSBMSB has formed a nice breakout pattern with higher highs on the daily, with the EMA moving very nicely with it as well. it has broken a key level of $1.535 with conformation with bullish candle on it's new support. Looking to the upside with this stock.
Buy MSBMSB has broken a key level of $1.535 and formed higher highs with the EMA trending nicely right next to it. Looking to buy to the upside.

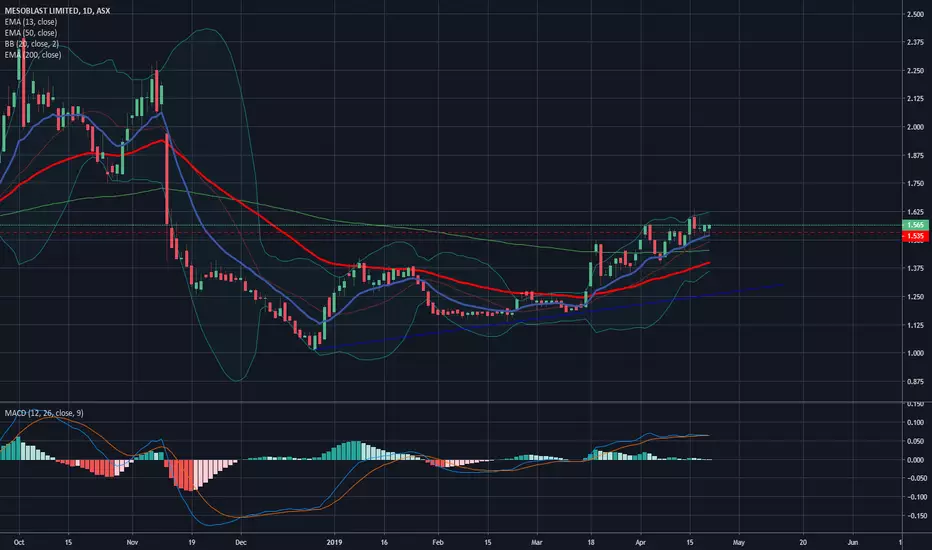
Buy MSBMSB has formed a nice break out trade with the EMA following it nicely on the daily, it's near the Res but it could break out today. Also the health sector looks like it could break out today as well forming a CwH pattern.

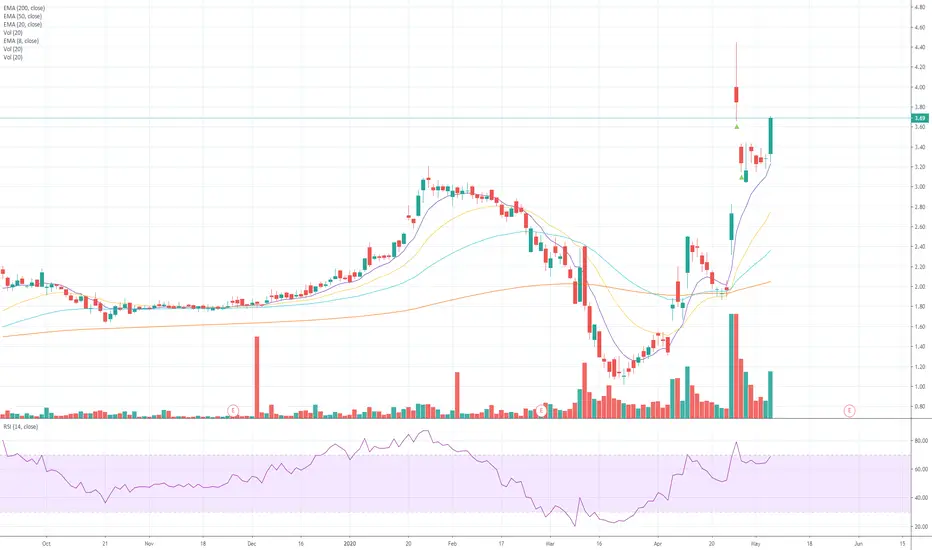
MESOMESO is sitting right under the 200 dma. If MESO can break above and close above the 200 dma then the look for a run to $8.00.


