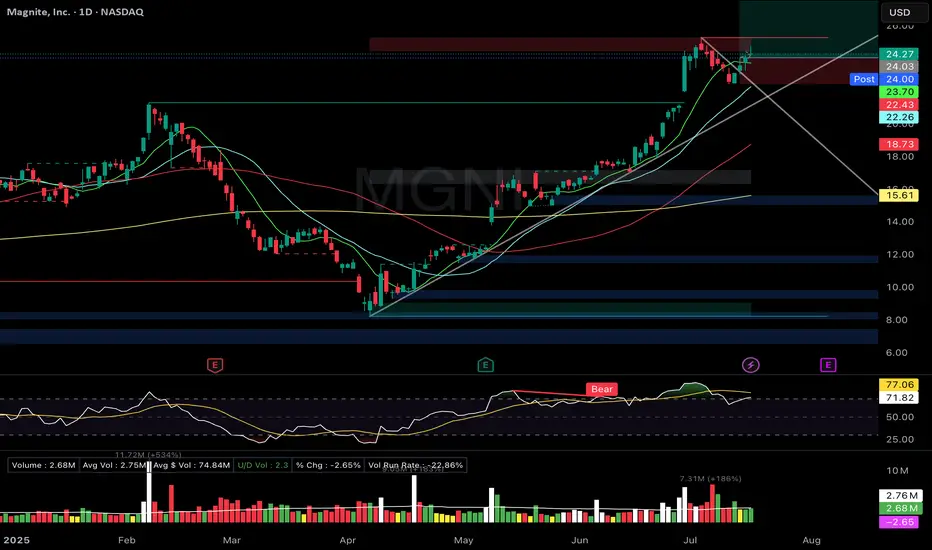
MGNI- Flag breakout. Long upper wick → cooling expectedMGNI – Magnite Inc.
Setup Grade: B+
• Entry: $24.03 (7/17)
• Status: Active
• Stop: $22.43
• Setup: Flag breakout. Long upper wick → cooling expected. RSI ~71.8 (overbought). ATH = $25.27.
• Plan: Hold unless stop breaks. Let RSI cool, watch for continuation.
• Earnings: August 6
MGNI trade ideas
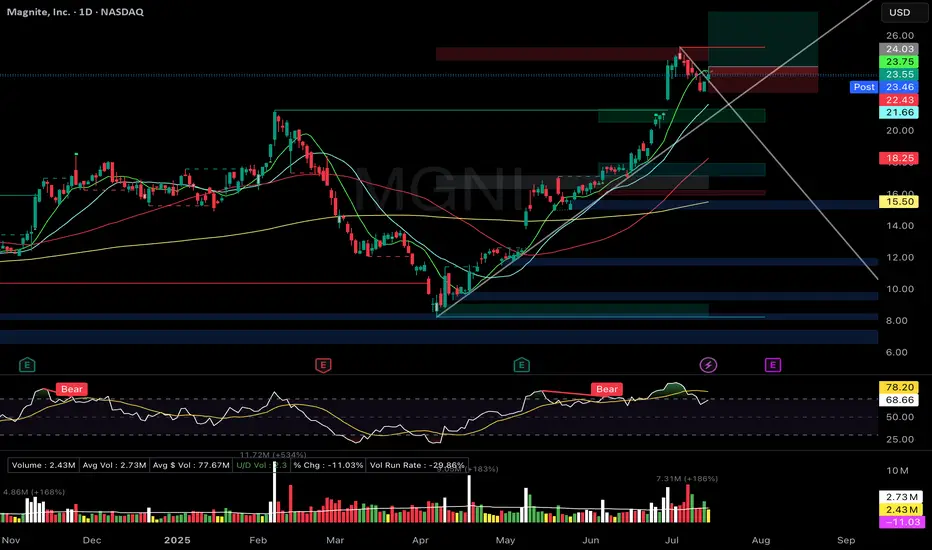
MGNI Zanger-style Bull Flag Breakout PullbackMagnite Inc. (MGNI)
🚀 Entry: $24.03
📊 Setup: Zanger-style Bull Flag Breakout Pullback
🛑 Stop: $22.43
🎯 Target: $27.50
🔑 Why I Entered:
Picture-perfect bull-flag pullback pattern with volume drying significantly, tapping precisely on the rising trendline.
Price action holding strong above rising short-term EMAs (9/21).
Excellent relative strength, reflecting a previous strong-volume breakout move.
🎯 What's Next:
Seeking strong volume surge confirmation to confirm continuation of the breakout.
Earnings report in three weeks—ready to take partial profits if price significantly appreciates ahead of the event.
Long Trade Setup Breakdown for Magnite, Inc. (MGNI) - 30-Min!📊
🔹 Asset: Magnite, Inc. (MGNI)
🔹 Timeframe: 30-Min Chart
🔹 Setup Type: Symmetrical Triangle Breakout
🚀 Trade Plan (Long Position):
✅ Entry Zone: $20.52 (Breakout Confirmation)
✅ Stop-Loss (SL): $19.72 (Below Support)
🎯 Take Profit Targets (Long Trade):
📌 TP1: $21.27 (First Resistance)
📌 TP2: $22.36 (Extended Bullish Target)
📊 Risk-Reward Ratio Calculation:
📈 Risk (Stop-Loss Distance):
$20.52 - $19.72 = $0.80
📈 Reward to TP1:
$21.27 - $20.52 = $0.75
💰 Risk-Reward Ratio to TP1: 1:0.9
📈 Reward to TP2:
$22.36 - $20.52 = $1.84
💰 Risk-Reward Ratio to TP2: 1:2.3
🔍 Technical Analysis & Strategy:
📌 Breakout Confirmation: Strong buying momentum above $20.52 signals continuation.
📌 Pattern Formation: Symmetrical Triangle Breakout, indicating bullish movement.
📊 Key Support & Resistance Levels:
🟢 $19.72 (Strong Support / SL Level)
🟡 $20.52 (Breakout Zone / Entry)
🔴 $21.27 (First Profit Target / Resistance)
🟢 $22.36 (Final Target for Momentum Extension)
🚀 Momentum Shift Expected:
If price sustains above $20.52, it could push towards $21.27 and $22.36.
Higher volume breakout would confirm strength in the trend.
🔥 Trade Execution & Risk Management:
📊 Volume Confirmation: Ensure buying volume remains strong after breakout.
📈 Trailing Stop Strategy: If price reaches TP1 ($21.27), move SL to entry ($20.52) to lock in profits.
💰 Partial Profit Booking Strategy:
✔ Take 50% profits at $21.27, let the rest run to $22.36.
✔ Adjust Stop-Loss to Break-even ($20.52) after TP1 is hit.
⚠️ Fake Breakout Risk:
If price drops below $20.52 after breakout, be cautious and watch for a retest before re-entering.
🚀 Final Thoughts:
✔ Bullish Setup – If price holds above $20.52, higher targets are expected.
✔ Momentum Shift Possible – Watch for volume confirmation.
✔ Favorable Risk-Reward Ratio – 1:0.9 to TP1, 1:2.3 to TP2.
💡 Stick to the plan, manage risk, and trade smart! 🚀🏆
🔗 #StockTrading #MGNI #BreakoutTrade #TechnicalAnalysis #MarketTrends #DayTrading #ProfittoPath

MGNI - Dec 24 Opening Sustainable Momentum
Grading B 6 points
No idea, it is a pure technical play +1
Greater force - There is alignment with RUT +2
Technicals - Break of consolidation, break below H1 SMA100, H1 Opening candle bull rejection candle +3
Opening Sustainable Momentum 🧑🏻🚀
Strategy
Signals identify market opening H1 candles through momentum and behaviour change that potentially could indicate a shift in the current price overall structure (Price gaps and ADR %).
Risk
We use the signal candle's highs and lows for entry and stop loss. If price hits the stop loss, it is clear that the shift we expected did not come to fruitation.
Current SL is at 0.25Fib
Focus
Focus is never on the signal candle alone, but it's role in the larger structure and the direction it is inclined towards with a minimum Risk & Reward of 2R.
Stock must be in a pull back or consolidation area waiting for a broad market momentum to ignite it forward.
Character
Trend, Positive Skew

MGNI Magnite,inc 24hr potterboxMGNI Magnite, Inc 24 hr potterbox . Magnite is trading above the top of the box.

MGNI Magnite,Inc 24hr potterbox MGNI Mahnite is trading at the top of a 24hr potterbox. That is the beauty of the strategy. If magnite opens below the top of the box , it will go back to the 50 percent line. if it holds then thats probly where it will stay all day. we shall see tomorrow.

MGNI: ADVERTSING company direction to $36 in a year --3month view, this company is a subsidiary of WPP, companies like GroupM, JWT. The american school system is in the market... check them out...not here.

MGNI following value channel 2021 trendline
Establishing it's rising trajectory prior to 2021, MGNI has established a value channel trend from 4 near today's price of 13. With the current pullback into the fib pocket I can see a possibility of the price being supported and continuing through the trend channel paired with positive developments at the company level and possible Google suite in ad tech upside tailwinds are present.

MGNI LongMGNI has a recent upswing, and has also formed a flag now. If it takes out the trigger price (11.53), then it has a decent chance of the trend continuation and should give atleast 1 r/r.

Cheap stock at strong supportLooks messy but also looks like the price wants to bounce hard of the trendline from June 2018. You don't need too much cash here, the stock is very cheap and highly volatile so be aware of that. SL triggers if a weekly candle closes under the trendline.

what's going on with MGNI? will see 16$ or what??The stock breaks through a resistance level and exits a shuffle band with supporting volume.
Starting to gather interest...
Buying - $10.3
Target - around $16
Not a recommendation, just sharing!
NASDAQ:MGNI

MGNI - Building Nicely. Breakout soon?
Another name that has showed strength when this sector has shown weakness last few days. Bodes very well for a breakout.
Upside targets 20, 28
Bear case: Gets sold hard here and dips below 12
Disclosure: Long via commons at 13.65

MGNI points out to higher valuationMGNI beat EPS and REV in a very competitive industry, pointing out that its market price is undervalued by the crowd.
The Co shows decent profitability and double-digit revenue growth. Moreover, the Co is committed to pro-active cost management - it slashes 6% of the workforce. it sounds not good, but this shows high adaption commitments.
Size your positions according to your risk tolerance.

Golden Cross after regressionMGNI Golden Cross after a long declining trend
Part of a larger change in the whole industry

MGNI Bullish Swing Stock has decreased significantly over the past months but has been having bursts of bullish movements alongside the overall market. Looks to have stabilized and started to increase slowly. Manage risk when entering and make sure to set a CL. Also is around the .618 retracement level which we would see if this were a wave 1 of a greater 5 wave series.

MGNI: SETTING UP MY LONG ENTRYMGNI :
Despite the fact that I like the fundamentals of this company long term, the below analyses is purely based on technicals .
As you can see the chart does not look that great, with all moving averages pointing downward. And the market has not been nice recently with growth stocks .
However, I'm looking to buy a few stocks as a long term investment .
I usually try to simplify my analyses as much as possible, so I avoid the unnecessary noise.
By looking at the weekly chart I see an important zone that has played many times in the past. This zone is between 11.75 and 13 .
This is where I'll be looking for an entry or multiple entries.
I also see a small divergence between RSI and the price, supporting the fact that we could see a nice bounce (for shorter term traders).
That's it! Let me know if you have comments.
Trade safe!

$MGNI daydreaming of a monster move Never say never. Accumulation pattern looks identical.. will be monitoring this stock for now.

MGNI Head & Shoulder pattern almost completed,death cross comingMGNI Head & Shoulder pattern almost completed,death cross coming, previous resistance becomes support, jump a little and then dump

MGNI - upRecovered after sell-off,
Now wedging nicely above the strong level from December 2020
For me looks like a buy at thins point.

Mastering elliot waves. MGNI. also s/r level.This post is a combo of an elliot tutorial and an analysis from s/r.
MGNI is above an important support/resistance line. Seems like it will continue higher. The s/r I am considering was around 33.50.
----
Elliot Wave condition "e" considerations (tutorial portion):
If m2 (plus one time unit) is completely retraced in the same amount of time (or less) that it took to form and m3 is longer and more vertical than m1 and m(-1) does not share any similar price territory with m1, the market may have completed a Complex Correction at m2 with a "missing" x-wave in the middle of m0; add ":c3" to the current Structure list of m1, place a dot in the center of m0 (around the same price level m1 completed) and place "x:c3?" to the right of the dot and ":5" to the left of the dot.
Do you think this consideration applies? I see that m(-1) almost shares no territory with m1 to the point where I'm willing to keep it in play. Then m3 just has to be longer and more vertical than m1, which it might do.
This means that the market may have completed a complex correction at m2 with a missing x-wave in the middle of m0. You can see m0 had a hitch on the way down right at the s/r pivot level area.

MGNI Bull flag on the weekly, daily looks very goodMGNI You can clearly see we are still in the long uptrend channel (blue lines). I bought in 2019 Telaria & Rubicon before they merged into MGNI. Averaged at 5s, but scaled out profits when the red and blue lines came together in the 55-60s. Here you can clearly see how to predict tops on a weekly timeframe. Entered position again at lower uptrend blue line of the channel. Will buy more if it ever hits the white line again, since I expect a rejection at the yellow downtrend line.
Also clear bull flag on the weekly as well as daily looks good. Add to positions on the blue and white uptrend lines. Yellow down trend line might act as resistance for now.

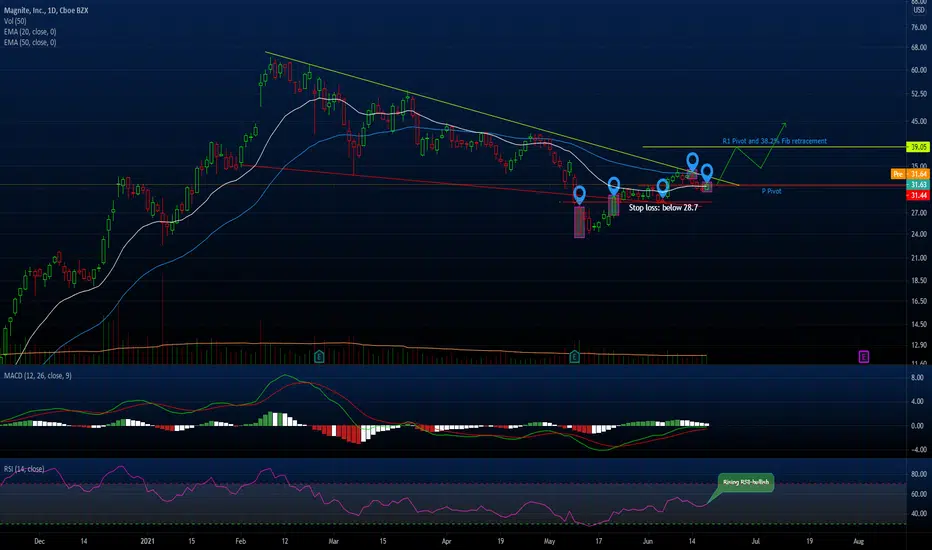
Breakout imminent?!This one looks like it will break-out soon.
Multiple bullish signs appeared on the chart (RSI, EMA, Pivot...)
After the breakout:
>Next resistance: 39.05
>Support: 31.44
Watch out for volume, it needs to be high during the breakout
MGNI primedMGNI is on watch the last Tru buy signal on the WEEKLY was in October, for $6.51, the rally to the 33s then the dip to 21 was in the middle, thats where I added shares, then we ran to 64s where the algo gave a sell at 60 bucks and I took profits. This is the weekly, once I see a signal generate off the 4 hr and Daily, this will give a buy. We should be in the clear until the test on 40.00 if we break that we will head to ATHs again.
