MMED AmazingCurrently at 217.44% benefits on that stock, I knew it was going to go up arghhh... I should have buy more hahah. Anyway I still have few of them. It will go more up
12/14/2020 - "MindMed Announces Successful Completion of Pre-IND Meeting with the FDA for Project Lucy"
12/08/2020- "MindMed Files Final Prospectus In Connection With Bought Deal Equity Financing"
11/06/2020 - "MindMed Receives Approval of Protocol Design to Evaluate Microdoses of LSD For Adult ADHD In Phase 2a Clinical Trial from Swiss and Dutch Health Authorities"
GOGO!!! MMED keep an eyes on them!
MNMD trade ideas

MMED MMED getting crazy for those past few days but for how long is it going to go up ? Are we expecting a drop anytime soon ??


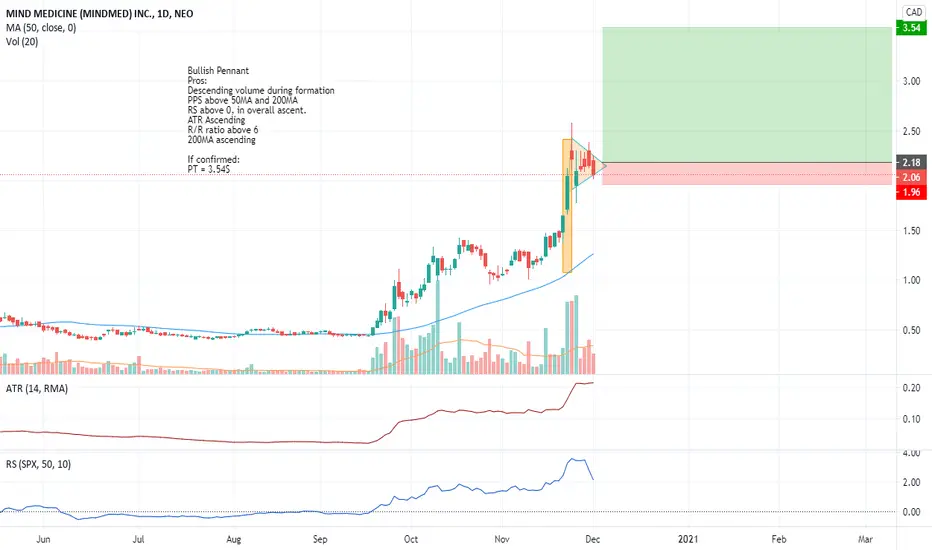
MMED: Bullish PennantBullish Pennant
Pros:
Descending volume during formation
PPS above 50MA and 200MA
RS above 0, in overall ascent.
ATR Ascending
R/R ratio above 6
200MA ascending
If confirmed:
PT = 3.54$
PULL BACK ENTER AT 156-171 RANGE - EXIT AT 2.10-2.20 RNGE OR HLDPULL BACK ENTER AT 156-171 RANGE - EXIT AT 2.10-2.20 RNGE OR HLD. Entry at 61.8 fib ret

MMED on breakout watchlist, potential long into earnings. I am hoping to buy the breakout tommorow if the conditions are met:
- opens near close or at least does not gap up too significantly.
- Breaksout of the 1.46 price target
Stop loss would be 1.20 to 1.25 range.
MMED, The Second Psychedelic Stock That Will Reach NASDAQAs some of you have witnessed CMPS IPO climb from 17$ to 43$ in 3 days, most of investors wonder what is the next psychedelic stock that will perhaps result in the same behavior. Of course, a lot of stocks from the psychedelic sector are still penny stocks and mostly Canadian stocks. Penny Stocks are a scary investment to some of you and I completely can relate and understand this. However, remember that around 3-5% of Penny Stocks still can be valuable stocks. But in any case, I am not here to convince you to invest in Penny Stocks or not, I am here to predict which one will rise and will have a very promising returns. The stock that I predict a strong rise called MMED or Mind Medicine, A Canadian penny stock traded on NEO exchange. The stock is a small cap, around 325 Million Dollars. Which leaves us a lot of space for a good long term rise. The stock by the time I write is around a 1.09$ and I am riding this stock from July, where it was around 0.45$. Around 6 weeks ago, MMED announced a NASDAQ up-listing, and rumors speculate that MMED will do a reverse split 4:1 in order to get the minimum price 4$ to be able to up-list on NASDAQ. In my experience, the stock is very reactive to news and rumors, and any announce of good news, will drive the stock 10% up minimum easily. Most of USA investors are not allowed to invest in Penny Stocks from any other exchange than NASDAQ, this is a good opportunity to buy this stock now and retail it on the NASDAQ up-listing to other investors. Of course, everything has a risk, and as MMED says, they do not guarantee to be accepted by NASDAQ, but once there is a confirmation, this stock will very bullish until the date to up-listing. I predict the price will hit minimum 2$ a share before NASDAQ, and once we up-list on NASDAQ, whether there was a reverse split or not, the day of up-listing will drive the stock minimum from 150% to 300% or more.
Edit: I do not take responsibility for any of your investment, strong return always represents a strong risk.

MMED is attractive at under 1.10 for longPrice support at the 1.00 mark as per the candles and volume.
BIG investor money at 1.05 Canaccord Genuity purchased 23,810,000 units at 1.05. Easy to say there is going to be good support here as they are likely to hold for long position as well.

Kevin O'leary adopted brainchild, Swing TradeJust another great company, in a sector that is about to go. Pscychodelics(Pharama). They are alreay in the cannabis market, however they are geared towards the next frontier, lsd, psylocibin, etc.
Its a swing trade, enter below a dolar, as it corrects violently. If it bounces of the dolar as tsx_trader is suggesting go all in to the next resistance, otherwise 80sh cents its a grea entry point.
Good Luck, definatly a hold once you enter, sell once it doubles and buy the correection again.

MMED attractive at the $1.00 markMMED had been on a tear recently and its cycling off finally.
I like it long term but In the mean time the MACD is rolling over to the down side. The RSI is showing that it was overbought and it will be rolling over down as well.
It may not go as low as $1. And it may go to 1 and then much lower.... You can never time it, but there is good support at the $1.00 level for sure!
I would enter into a position at $1 personally. Will keep watching this one.

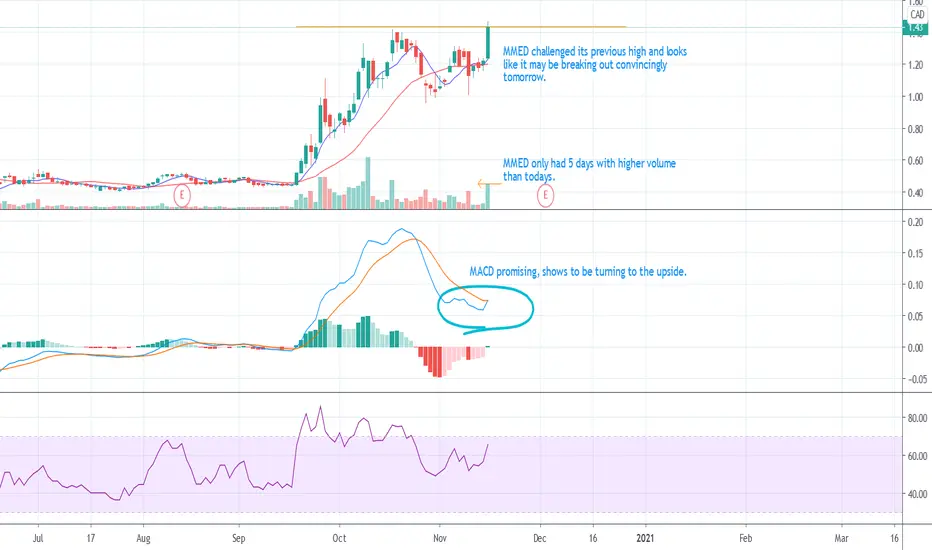
MMED may experince exponential growthGood overall market coniditions moving into This weeks training, this company has a great plan and creates a product for which it could become really successful. Chart is moving up majorly although last 2 trading days we saw a decline in Volume.
My favorite place to enter would be the 1.00 mark as its shown great support.
1.11 also has some support which was tested two days in a row recently.
Otherwise I would buy into the break out. Better yet, be disciplined and enter the trade at three different intervals.

Path for MMEDBullish on this long term but for the time being I believe the price may correct itself in a cool-down after its breakout.
MACD- showing signs of slowing as the fast indicator is reversing path
RSI- showing a clear, yet slow uptrend.. we may see the RSI approach the yellow line... may not hit it exactly
SAR - we have our TOP dot, meaning the parabolic movement is reversing hence, stop and reverse
Price levels I am personally anticipating: I'm looking at the $0.55-0.6 zone, but keep on eye on your EMA's and SAR and other indicators
These are my ideas and not financial advice, Happy Trading

MMED new points for entryThe MACD and RSI arent helping here. This stock has only been trading for so little. It has promise for the long term on speculative basis at this time. I am looking at my next place to enter this trade. Do not enter now!!!! Wait for it to reach a good point for entry.
Since it started trading it has bounced off of 3 points highlighted in the chart.
The 0.51 area was once good suppot, which later became good resistance that was broken through. I feel that this would be ideal location for entry into the trade. however, there is good support at the .66 area.
I fear that if you dont buy at .66, you may miss out on some nice gains.
Without a doubt, the way this chart moves is very intresting, notice big candles to the upside (only one or two) followed by big red canadals down (1 or 2) after which it rests for some time.
I will enter the position in three increments of $200 investments each (total $600) at .66, at .51 and should it keep going down, at the area of .44 ish. If I enter somewhere and it bounces, I will just take my profits and wait for it to come back down.

Potential descending channel for MMED?The green upward sloping line of support is potentially keeping a bullish flag in play here, but it appears as though downward pressure is indicating there may be a retest of the bottom blue channel where I have the red arrow pointing down.
KEY TAKEAWAYS
A descending channel is drawn by connecting the lower highs and lower lows of a security's price with parallel trendlines to show a downward trend.
Traders who believe a security is likely to remain within its descending channel can initiate trades when the price fluctuates within its channel trendline boundaries.
A more potent signal occurs with a breakout, which is when a security's price breaches an established channel's boundaries, either on the upper or lower side.

Breakout of down trendHello Traders,
MMED has broken out from a recent steady downtrend. The upside breakout occurred one day after a news announcement (new potential pipeline and phase 1 testing). Note that the down trend was losing steam from a volume perspective, which in my opinion is the second best indicator after price action (it's unfortunate forex does not have accurate volume information!). The reversal point also has ratio confluence and some minor structure tests.
Thanks,
PS

Possible C&H on MMED. Target $1.3If MMED breaks out of the channel on high volume then its a likely Cup and Handle.
