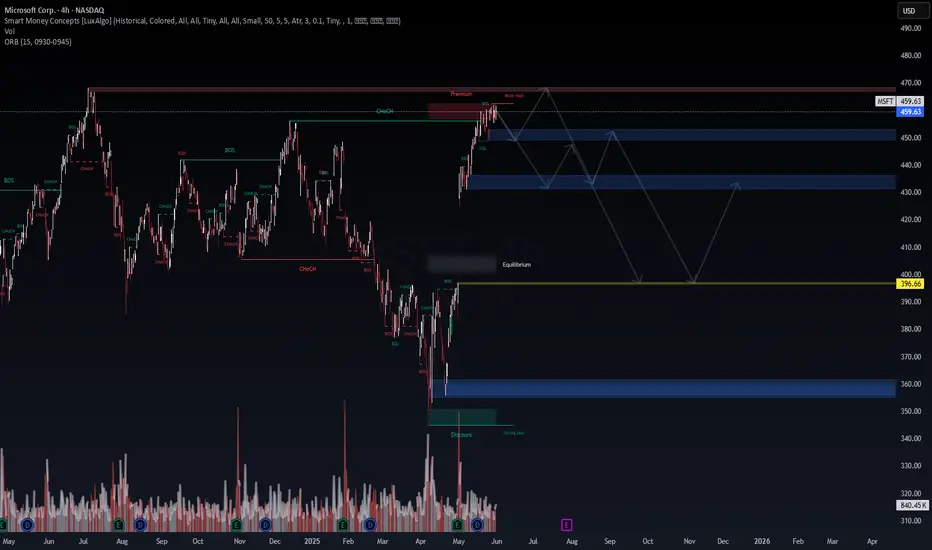
Microsoft Corp. (MSFT) – Smart Money Concepts | Liquidity Trap This chart outlines a high-probability liquidity run reversal setup driven by SMC principles. Price has reached Premium territory, sweeping the weak high and now showing signs of distribution.
🔍 Key Levels & Structure:
Current Price: $459.63
Premium Zone: $457–462 → Price swept weak high (liquidity engineered)
Break of Structure (BOS): Seen post-CHoCH, signaling bearish shift
Equilibrium Target: $396.66 (macro midpoint)
Discount Refill Zone: $355–365 (previous accumulation base)
📊 Strategy & Setup:
Wait for confirmation of BOS below $450
First Re-entry Opportunity: $445–448 supply zone retest
Second Re-entry: $432–435 mitigation block
Final Buy Zone: $355–365 if deeper liquidity grab unfolds
Final Target (Mean Reversion): $396.66
🔄 Institutional Flow Logic:
Smart Money likely induced breakout liquidity above weak high.
Now expecting distribution and redistribution cycles on the way to equilibrium.
Ideal setup for swing traders or position traders aligning with SMC framework.
📌 If the market fails to hold above $462, this could trigger a cascade of BOS levels and internal breakouts all the way back to the discount zone.
#MSFT #SmartMoneyConcepts #SMC #LiquiditySweep #OrderBlocks #BreakOfStructure #TradingStrategy #WaverVanir #Equilibrium #MarketStructure #TradingView
MSFT trade ideas
MSFT short, Broader Market Weakening.Weekly:
MFI divergence: Smart money flow pulling back while price pushes up — early warning sign of distribution.
Price touching upper Bollinger Band: Extended move on volatility basis; usually implies reversion risk, especially if paired with divergence.
Daily:
Overbought RSI: Price momentum overstretched.
RSI Bearish Divergence: Momentum slowing while price makes new highs — classic reversal signal.
MACD Bearish Crossover: Bearish momentum shift confirmed.
Volume Divergence: Lower volume on recent up moves or spike on down bars — lack of conviction on the rally.
✅ Multiple uncorrelated indicators (momentum, volatility, volume, price action) pointing to a short-term reversal.
✅ Higher time frame (weekly) divergences + Daily confirmations — that’s powerful confluence.

Microsoft Wave Analysis – 29 May 2025
- Microsoft reversed from resistance zone
- Likely to fall to support level 447.00
Microsoft recently reversed down from the resistance zone located between the resistance levels 465.00 (which stopped the weekly uptrend in 2024) and 455.00 (top of wave (B) from the end of 2024).
This resistance zone was further strengthened by the upper weekly and daily Bollinger Bands.
Given the strength of the aforementioned resistance zone and the overbought daily Stochastic, Microsoft can be expected to fall to the next support level 447.00.

Microsoft’s Market Puzzle — The X2 ConundrumAfter a corrective decline from Microsoft’s All-Time High at $467.70, we’ve been tracking a potential complex structure unfolding — and the recent price behavior fits right into a well-formed W–X–Y–X–Z pattern .
In this latest move, we may be witnessing the final stages of the second X-wave (X2) — a sharp and extended rally that reached $462.52, pushing marginally above the first X-wave at $456.16.
Now before that raises eyebrows — yes, X2 is allowed to extend above X1 . In a complex correction, X-waves are connectors, not trends. They can retrace deeply or even overshoot previous pivot highs — especially in the form of an expanded zigzag or running correction. It’s rare, but perfectly legal in Elliott’s chaotic universe.
But this leads to a question:
Is this rally impulsive… or is it bait?
If the move from $344.79 is truly impulsive, then we’re potentially mid-way through a new bullish leg — with wave 3 ending at $462.78, and a mild wave 4 correction into the $437–$421 zone (0.236–0.382 retracement) expected before another pop higher. This view only holds as long as price remains below the ATH at $467.70 — our immediate invalidation level .
However, momentum indicators raise suspicions:
RSI is showing a clear bearish divergence — price made a new high, but RSI didn’t confirm it.
MACD has started rolling over, with a fading histogram — signaling potential exhaustion in this move.
This sets the stage for an alternate, and perhaps more compelling, scenario:
The rally from $344.79 to $462.78 is not a new trend — it’s the X2 wave in a still- unfinished W–X–Y–X–Z combo correction .
If this is the case, then what comes next is Wave Z — the final leg down to complete the entire corrective structure.
And here’s the Elliott rulebook:
Wave Z must be a 3-wave structure (likely a zigzag)
It often mirrors the size of Wave Y or contracts modestly
Projection for Z from the X2 top targets the $393–$351 zone, which represents a 0.618–1.0 retracement of the Wave Y decline
This zone becomes the primary downside watch area, should price reject from this level and fail to break above $467.70.
Summary:
We’re at a critical junction.
The rally from $344.79 could either be:
An impulsive move needing a wave 4 pullback
Or a complex X2 wave — ready to hand over the baton to Wave Z
Both scenarios require careful tracking of structure, MACD, RSI, and price action near the retracement zone and the ATH invalidation level.

MSFT Breaking out? 4 Things Need to be Fixed FirstIn the last 2 weeks, MSFT broke above 2 major pivot levels $448 and $455 – that’s just 4 weeks after hitting a 52-week low on April 7th
Some would say that this represents huge momentum – and that the stock is ready for a major breakout above all-time high level and fly above $470
I have 4 issues with that view – that I need the stock to go through first and “prove itself” – let’s take a look at them quickly
1. Daily Shows Exhaustion: The last few daily bars are not reflecting confidence in the price moves – they reflect exhaustion – that’s almost all last week – the price struggled to close at the day’s high.
2. Missing the Right Alignment: The 50SMA is still below the 100SMA – that shows the bulls will still need a “breather” to consolidate their efforts and the key SMAs to align properly. In the daily view we also see how extended the price is (look at the purple line 20SMA wrt the other MA's)
3. Over-bought Weekly: The weekly chart shows the stock as over-bought, supporting the view that some profit taking and consolidation need to happen first before a serious breakout to new highs
4. Unsupportive Market: The market is still not recovered – we’re still in “daily-news-jumpy-sensitive” mode – there are even opinions that we’re in a bear market rally. Then some large money are waiting to see the outcome of tariffs and other decisions that will have lagging impact in June & July .. for me this is the most critical factor.
MSFT continues to be one of the best plays out there, so as we build up the position in our portfolio, let’s keep an eye on these factors and await setups with higher probabilities.
As usual, this is not a trading recommendation - just my own quick analysis
- please feel free to share your thoughts.

MICROSOFT Correction ahead of 1st 1D Golden Cross in 2 years?Microsoft (MSFT) is just below the $470 All Time High (ATH) and last technical Resistance, following the remarkable rally on the April 07 2025 bottom.
By the first week of June, it should technically form a 1D Golden Cross, which will be its first in more than 2 years (since March 17 2025). That Golden Cross was formed just after the price pulled-back on the 0.382 - 0.5 Fibonacci retracement Zone, finding support on its 1D MA50 (blue trend-line) and rebounding.
As a result, it is quite possible to see a short-term correction to at least $420 before the 1D Golden Cross restores the bullish sentiment. That previous structure eventually hit the -1.0 Fibonacci extension, before the next 1D MA50 test. We therefore expect to see $630 in 2025 before a 1D MA50 correction again.
-------------------------------------------------------------------------------
** Please LIKE 👍, FOLLOW ✅, SHARE 🙌 and COMMENT ✍ if you enjoy this idea! Also share your ideas and charts in the comments section below! This is best way to keep it relevant, support us, keep the content here free and allow the idea to reach as many people as possible. **
-------------------------------------------------------------------------------
💸💸💸💸💸💸
👇 👇 👇 👇 👇 👇

What Is Stock Tape Reading, and How Do Traders Use It?What Is Stock Tape Reading, and How Do Traders Use It?
Tape reading is a real-time market analysis method used to track buying and selling pressure. Unlike technical indicators, which rely on historical data, tape reading focuses on executed trades, order flow, and liquidity shifts. Traders use it to assess momentum, identify institutional activity, and refine trade timing. This article explores how tape reading works, its role in modern markets, and how traders apply it to short-term decision-making.
The Origins and Evolution of Tape Reading
Tape reading began in the late 19th century when stock prices were transmitted via ticker tape machines, printing a continuous stream of price updates on paper strips. Traders would gather around these machines, scanning for large trades and unusual activity to anticipate market moves. One of the earliest and most well-known tape readers, Jesse Livermore, built his fortune by studying these price changes and spotting institutional buying and selling patterns.
By the mid-20th century, as markets became faster and more complex, ticker tape machines were replaced by electronic order books. Instead of scanning printed numbers, traders began using Level 2 market data and time & sales windows to track order flow in real time. This transition allowed for more precise liquidity analysis, making it easier to see how large orders impacted price movement.
The rise of algorithmic and high-frequency trading (HFT) in the 2000s further changed the landscape. Today, market depth tools, order flow software, and footprint charts have replaced traditional tape reading, but the core principle remains the same: analysing how buyers and sellers interact in real time. While charts and indicators offer historical insight, tape reading provides a direct window into current market behaviour, giving traders an edge in fast-moving conditions.
How to Read the Tape
Nowadays, tape reading is all about real-time market data—watching when and how orders are placed and filled to gauge momentum and liquidity. Unlike technical indicators, reflecting past price action, tape reading focuses on what’s happening right now. Stock, forex, and commodity traders use it to assess buying and selling pressure, spot large orders, and understand market sentiment as it unfolds. Here is the key information provided by tape reading:
Time & Sales
The time & sales window (the tape) displays every completed trade. Each entry shows time, price, trade size, and whether it hit the bid or ask.
- Trades at the ask suggest aggressive buying, as buyers are willing to pay the market price.
- Trades at the bid indicate selling pressure, as sellers accept lower prices.
- Large block trades often signal institutional activity—tracking these can reveal where big players are positioning.
Bid-Ask Activity
Nowadays, an order book is a part of tape reading. The order book (Level 2 or DOM) shows the number of buy and sell orders at different price levels. While not all orders get filled, traders watch for:
- Stacked bids (a high concentration of buy orders) near a price level, which may indicate strong buying interest.
- Stacked offers (large sell orders) acting as resistance.
- Orders rapidly appearing or disappearing, suggesting hidden liquidity or fake orders meant to mislead traders.
Volume and Trade Size
Changes in trade size and volume help traders judge the conviction behind a move:
- Consistent large trades in one direction can suggest institutions accumulating or distributing a position.
- A surge in small trades may indicate retail participation rather than institutional moves.
- A sudden drop in trade activity after a sharp move may hint at exhaustion or a potential reversal.
Trade Speed
The pace of executions matters.
- Fast, continuous transactions suggest urgency—buyers or sellers are aggressively taking liquidity.
- A slowdown in transactions near a key level can indicate hesitation or a shift in sentiment.
Tape Reading vs Technical & Fundamental Analysis
Tape reading differs from technical and fundamental analysis in both approach and timeframe. While technical traders study historical price patterns and fundamental analysts focus on company performance and economic data, tape readers focus on real-time order flow to assess market direction as it develops.
Technical Analysis
Technical traders rely on chart patterns, moving averages, and oscillators to identify trends and potential turning points. These tools are built on past price data, meaning they lag behind actual market activity. For example, a trader using a moving average crossover strategy waits for confirmation before acting, whereas a tape reader sees momentum shifting as it happens by watching the flow of orders.
Fundamental Analysis
Fundamental analysis is longer-term, based on financial statements, earnings reports, and macroeconomic indicators. Investors using this approach focus on factors like revenue growth, interest rates, and industry trends to decide whether a stock is undervalued or overvalued. Tape reading, by contrast, ignores these metrics entirely—it’s used by short-term traders reacting to immediate buying and selling pressure.
Where Tape Reading Fits In
Many traders combine approaches. A day trader might use technical analysis to find key price levels and then apply tape reading to fine-tune entries and exits. Similarly, a swing trader tracking earnings reports may use tape reading to see how large players are reacting. Each method provides different insights, but tape reading offers a unique advantage: it reveals market sentiment in real time, helping traders assess momentum before price movements become obvious.
Advantages and Disadvantages of Tape Reading
Tape reading gives traders an inside look at real-time market activity, but it also comes with challenges, especially in modern electronic markets.
Advantages
- Immediate Market Insight: Unlike lagging indicators, tape reading reflects live buying and selling pressure, helping traders react before price changes become obvious.
- Identifying Large Buyers & Sellers: Institutions often execute orders in patterns, leaving clues in the stock market tape. Recognising these can help traders gauge potential price direction.
- Fine-Tuning Entries & Exits: By tracking order flow near key price levels, traders can time their trades more precisely rather than relying on static chart signals.
- Useful in Fast-Moving Markets: Tape reading can be particularly valuable in scalping and day trading, where short-term momentum plays a key role.
Disadvantages
- Algorithmic Trading Distortion: High-frequency trading firms place and cancel orders rapidly, making it harder to interpret true supply and demand.
- Steep Learning Curve: Unlike technical analysis, which provides visual patterns, tape reading requires experience in spotting meaningful order flow changes.
- Mentally Demanding: Constantly watching the tape can be exhausting, requiring a high level of focus and quick decision-making.
- Less Effective in Low-Volume Markets: When liquidity is thin, tape reading becomes unreliable, as fewer trades mean less actionable data.
Modern Footprint Charts and Order Flow Software
While some stock tape readers rely on raw order flow data, many use footprint charts and order flow software to visualise buying and selling pressure more effectively.
Footprint charts display executed trades within each price bar, showing volume distribution, bid-ask imbalances, and point of control (POC)—the price level with the highest traded volume. This helps traders see where liquidity is concentrated and whether buyers or sellers are in control.
Order flow software offers heatmaps, cumulative delta, and volume profile tools. Heatmaps highlight resting liquidity in the order book, revealing where large players may be positioned. Cumulative delta tracks the difference between market buys and sells, helping traders assess momentum shifts.
These tools provide a more structured approach to tape reading, filtering out noise and making it easier to spot large orders, absorption, and potential reversals. While experience is still essential, modern software gives traders a clearer view of market behaviour beyond just raw time & sales data.
The Bottom Line
Reading the tape remains a valuable tool for traders looking to analyse real-time order flow and market liquidity. While there are numerous algorithms that place trades, understanding executed trades and bid-ask dynamics can provide an edge in fast-moving conditions.
FAQ
Is Tape Reading Still Useful in Trading?
Yes, but the application of tape reading in trading has changed. While traditional tape reading focuses on printed ticker tape, modern traders use time & sales data, Level 2 order books, and footprint charts to analyse order flow. High-frequency trading and algorithmic activity have made tape reading more complex, but it remains valuable for scalpers, day traders, and those tracking institutional activity.
What Are the Principles of Tape Reading?
Tape trading is based on real-time order flow analysis. Traders focus on executed trades (time & sales), bid-ask activity (order book), volume shifts, and trade speed to gauge buying and selling pressure. The goal is to understand how liquidity moves in the market and spot signs of institutional accumulation or distribution.
What Is the Difference Between Order Book and Tape?
The order book (Level 2 or DOM) shows pending orders at different price levels, representing liquidity that may or may not get filled. The tape (time & sales) displays completed transactions, showing actual buying and selling activity in real time.
What Is the Difference Between Technical Analysis and Tape Reading?
Technical analysis relies on historical price patterns and indicators, while tape reading focuses on real-time executed trades and market depth. Technical traders look at charts, whereas tape readers analyse live order flow to assess momentum and liquidity shifts.
How to Read Ticker Tape?
Modern ticker tape is displayed in time & sales windows on trading platforms. Traders monitor price, trade size, and whether transactions occur at the bid or ask. Rapid buying at the ask suggests demand, while consistent selling at the bid indicates selling pressure.
This article represents the opinion of the Companies operating under the FXOpen brand only. It is not to be construed as an offer, solicitation, or recommendation with respect to products and services provided by the Companies operating under the FXOpen brand, nor is it to be considered financial advice.

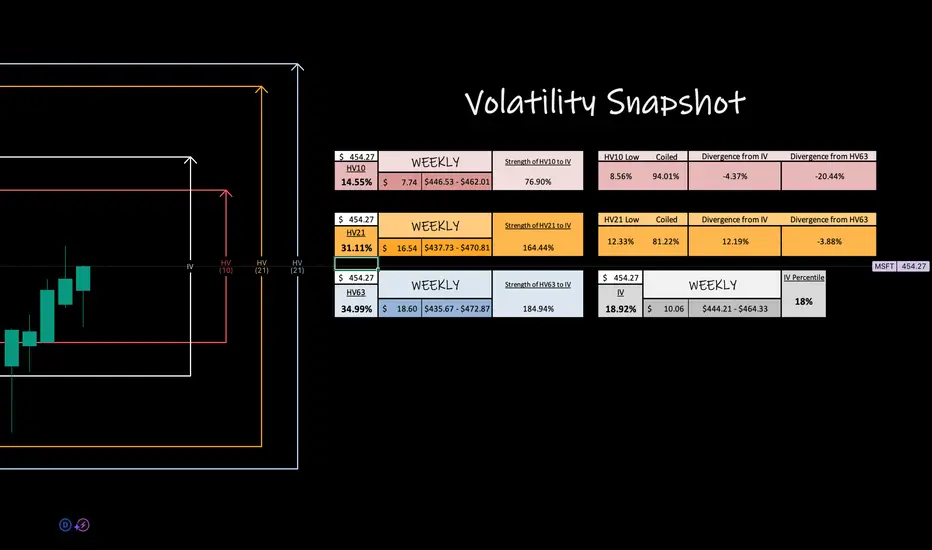
Microsoft, Inc -- Weekly PotentialVolatility, expressed through standard deviation, quantifies market elasticity and presents a level of probability and precision that humbles us all.
I wanted to take a look at at least one of the magnificent 7s with the community this weekend, so I decided on NASDAQ:MSFT because it had the lowest IV of them all.
Lowest IV = best premium value, right? Well it can, but it can also be leading onto more consolidation especially after a big move up like NASDAQ:MSFT has recently done.
Here, we see that HV21 has just come out of it's regression to quarterly means and now is consolidating lower with bi-weekly coiling towards it's yearly lows.
See what I'm doing? Ill be watching for HV21 dropping and HV10 bottoming..there we will find our volatility bounce again. Some of the coolest magic happens when HV10 is at lows at does the HUGE swing back up to quarterly means. SO STAY TUNED!!
BOOST the post, drop a follow and comment, BUT don't forget to circle back at the end of the week to revisit and observe how our trending markets preformed!
MSFT - PULLBACK BUT WILL IT HOLDGood Morning,
MSFT had an amazing performance the last several weeks. We are now in a corrective wave with MSFT. This could prove good support and hold for another powerful wave or it could tumble into the gap it created earlier on in the trend. This will take a close eye to make sure your trade stays on track.
Two perspectives gives you the opportunity to assess your risk and where you may want to TP and re-enter a new trade.
ENJOY!

TSLA, META, MSFT, PLTR Daily Trade SetupsIn this update we review the recent price action in Tesla, Microsoft, Meta and Palantir and identify the next high-probability trading setups and price targets. To review today's video analysis, click here!

$MSFTNASDAQ:MSFT still holding strong around $430.
Even with tech moving fast and competition rising, Microsoft remains solid in key sectors.
👀 Buyers aren’t letting go demand is steady.
Don’t sleep on this one.
#MSFT #TechStock

What Fuels Microsoft's Unstoppable Rise?Microsoft Corporation consistently demonstrates its market leadership, evidenced by its substantial valuation and strategic maneuvers in the artificial intelligence sector. The company's proactive approach to AI, particularly through its Azure cloud platform, positions it as a central hub for innovation. Azure now hosts a diverse array of leading AI models, including xAI’s Grok, alongside offerings from OpenAI and other industry players. This inclusive strategy, driven by CEO Satya Nadella's vision, aims to establish Azure as the definitive platform for emerging AI technologies, offering robust Service Level Agreements and direct billing for hosted models.
Microsoft's AI integration extends deeply into its product ecosystem, significantly enhancing enterprise productivity and developer capabilities. GitHub's new AI coding agent streamlines software development by automating routine tasks, allowing programmers to focus on complex challenges. Furthermore, Microsoft Dataverse is evolving into a powerful, secure platform for AI agents, leveraging features like prompt columns and the Model Context Protocol (MCP) server to transform structured data into dynamic, queryable knowledge. The seamless integration of Dynamics 365 data within Microsoft 365 Copilot further unifies business intelligence, enabling users to access comprehensive insights without switching contexts.
Beyond its core software offerings, Microsoft's Azure cloud provides critical infrastructure for transformative projects in highly regulated sectors. The UK's Met Office, for instance, successfully transitioned its supercomputing operations to Azure, improving weather forecasting accuracy and advancing climate research. Similarly, Finnish startup Gosta Labs utilizes Azure's secure and compliant environment to develop AI solutions that automate patient record-keeping, significantly reducing administrative burdens in healthcare. These strategic partnerships and technological advancements underscore Microsoft's foundational role in driving innovation across diverse industries, cementing its position as a dominant force in the global technology landscape.

MSFT... Microsoft viewed by DXY ratio and pitchforkSame as before..just stock vs DXY and then plot points matched from bottom to top..
Hitting an interesting level..no?

MSFT futurethis is fundamental for msft for showing how correlative analysis' works. if this breaks then tesla is a long and so is the SPY and QQQ

Trimming Position on $MSFTIf you purchased Microsoft shares at a wholesale price, the current market level is a good time to trim your holdings. Consider selling some shares to lock in profits, while leaving a portion behind in case the stock continues to rise.

Trade Idea: $MSFT Short to $418 and beyond into JuneTriple bearish divergence is evident on Volume, RSI, and Momentum. The 9-count sell signal on the daily chart further supports the likelihood of a sell-off at this point. If the price falls below $425, a swift decline to $418 is anticipated, where the true test of the Fair Value Gap (FVG) below will occur. The Fair Value Gap open is at $392.45. Stop would be above yesterday's high at $439.50 ...


MSFT - Potential bull flag/pennantSimple technical analysis showing what seems to be a bull flag on MSFT on the weekly chart. No rocket science - those who know what a bull flag is, will know exactly what this means.
Disclaimer: Not financial advice

What Is Random Walk Theory and Its Implications in Trading? What Is Random Walk Theory and Its Implications in Trading?
Random walk theory argues that market prices move erratic, making it difficult to analyse past data for an advantage. It suggests that technical and fundamental analysis provide little to no edge, as prices instantly reflect all available information. While some traders embrace this idea, others challenge it. This article explores the theory, its implications, criticisms, and what it means for traders navigating financial markets.
What Is Random Walk Theory?
Random walk theory reflects the idea that financial markets move erratic, making it impossible to analyse past price data for an advantage. The theory argues that price changes are random and independent, meaning past movements don’t influence future direction. This challenges both technical and fundamental analysis, arguing traders who attempt to time the market are essentially guessing.
The concept was first introduced by Maurice Kendall in 1953, who found no meaningful patterns in stock prices. Later, Burton Malkiel popularised it in A Random Walk Down Wall Street (1973), arguing that a blindfolded monkey throwing darts at a stock list would perform as well as professional traders. The underlying principle is that markets are efficient, instantly reflecting all available information.
The theory states that prices truly follow a random path, so a trader analysing charts or company reports has no statistical edge. It’s like flipping a coin—the next move is unrelated to the last. This has major implications: active trading strategies become questionable, and passive investing (e.g., index funds) may be a more logical approach.
However, while randomness can explain short-term price movements, longer-term trends still emerge. Factors like liquidity, institutional flows, and investor psychology create periods where price action deviates from pure randomness. This is where the debate arises—are markets entirely random, or do trends exist that skilled traders can take advantage of?
Understanding random walk theory helps frame this debate, offering insight into why some traders dismiss traditional analysis while others continue searching for patterns in price action.
Theoretical Foundations and Key Assumptions
The random walk hypothesis is based on mathematical models and probability, arguing that financial markets follow a stochastic process—where future price movements are independent of past trends. It builds on several key principles that shape how economists and traders view market efficiency and price behaviour.
Market Efficiency and Information Absorption
A core assumption of random walk models is that markets are efficient, meaning all available information is already reflected in asset prices. If new data emerges, prices adjust instantly, making it impossible to gain an edge through analysis. This aligns with the Efficient Market Hypothesis (EMH), which classifies efficiency into three forms:
- Weak form: Prices already reflect past movements, rendering technical analysis ineffective.
- Semi-strong form: Fundamental data (e.g., earnings reports) is priced in immediately, limiting the usefulness of research.
- Strong form: Even insider information is priced in, meaning no trader has an advantage.
Brownian Motion and Stochastic Processes
The theory borrows from Brownian motion, a model describing random movement, often used in random walk algorithms to simulate stock price fluctuations. Prices are treated as a series of independent events, much like molecules colliding in a gas.
No Clear Patterns
If prices truly follow a random walk, trends and cycles do not exist in a statistically significant way. This challenges traders who attempt to use historical data to analyse future movements.
Implications for Traders and Investors
If random walks in trading are truly the norm, then analysing market movements using historical price data is no more effective than flipping a coin. This has significant implications for both traders and long-term investors.
For traders relying on technical analysis, random walk theory presents a major problem. If price changes are independent, then tools like support and resistance, trendlines, and moving averages hold no real value. The same applies to fundamental analysis—if all available information is instantly priced in, then even detailed financial research doesn’t offer an edge.
This would mean day traders and swing traders aren’t consistently able to generate higher returns than the broader market. It’s why proponents of the theory often argue that attempting to time the market is a losing battle in the long run.
However, many supporters of the random walk theory advocate for passive investing, arguing that since, for example, individual stock movements are erratic, holding a diversified index fund is a more rational approach. Instead of trying to outperform the market, investors simply track it, reducing costs associated with frequent trading.
Criticism and Counterarguments
While random walk theory argues that market movements are independent, real-world trading data argues that markets are not entirely random. Critics point to patterns, inefficiencies, and the effectiveness of certain trading strategies as evidence that price action isn’t purely a coin flip.
Market Inefficiencies Exist
One of the biggest challenges to random walk theory is that markets display recurring inefficiencies. Certain price behaviours, like momentum effects, mean reversion, and seasonal trends, suggest that past movements do have an impact on future price action. For example:
- Momentum strategies: Studies show that assets that have performed well over the past three to twelve months tend to continue in the same direction. If price action were purely random, these trends wouldn’t exist.
- Earnings reactions: Stock prices often drift in the direction of an earnings surprise for weeks after the announcement. If markets were perfectly efficient, all adjustments would happen instantly.
Real Results
Random walk theory suggests that no trader can systematically outperform the market over time. Yet, some fund managers and proprietary traders have done exactly that. Warren Buffett’s long-term track record is often cited as evidence that skill, not just luck, plays a role in investing and trading. Similarly, hedge funds employing quantitative strategies have consistently generated returns, challenging the idea that price movements are entirely random.
The Adaptive Markets Hypothesis
A more flexible alternative is Andrew Lo’s Adaptive Markets Hypothesis, which seeks to reconcile the EMH’s claim that markets are rational and efficient with behavioural economists’ argument that markets are, in reality, irrational and inefficient. Instead of being entirely random, markets evolve based on participants’ actions, allowing patterns to emerge.
While random walk theory provides a useful framework, real market behaviour often deviates from its assumptions, leaving room for traders to find potential opportunities beyond pure randomness.
Practical Considerations for Traders
Even if markets exhibit randomness in the short term, traders still need a structured approach to analysing price action and managing risk. While random walk theory challenges traditional methods, it doesn’t mean traders should abandon analysis altogether. Instead, it highlights the importance of probabilistic thinking, risk control, and understanding market conditions.
Short-Term vs. Long-Term Price Behaviour
Markets may behave randomly on a daily or weekly basis, but longer-term trends can emerge due to liquidity shifts, institutional positioning, and macroeconomic factors. Traders focusing on short-term moves often work with probabilities, using statistical models and historical tendencies to assess risk and potential trade opportunities.
Risk Management in an Uncertain Market
If price movements are largely unpredictable, risk control becomes even more important. Traders typically limit their exposure using stop losses, position sizing, and diversification to avoid being caught on the wrong side of market volatility. Instead of focusing on certainty, they manage the probability of different outcomes.
The Role of Quantitative Strategies
While traditional chart patterns may be questioned under random walk theory, quantitative and algorithmic strategies analyse large datasets to identify inefficiencies. High-frequency trading firms, for example, exploit microsecond price discrepancies that aren’t visible to the human eye.
Rather than proving whether markets are fully random, traders adapt by testing, refining, and adjusting their strategies based on what works in real conditions. The most experienced traders accept uncertainty but structure their approach around probabilities and risk management.
The Bottom Line
Random walk theory challenges the idea that past price movements provide an edge, arguing that markets move erratically. While some traders accept this and focus on passive investing, others analyse inefficiencies to find potential opportunities.
FAQ
What Is the Random Walk Theory?
Random walk theory suggests that asset prices move unpredictably, with past movements having no influence on future direction. It argues that markets are efficient, meaning all available information is instantly reflected in prices. This challenges the idea that traders can consistently outperform the market using technical or fundamental analysis.
What Is the Meaning of the Random Walk Fallacy?
Critics of the theory argue that the random walk fallacy is the mistaken belief that financial markets move in a completely random manner, disregarding factors such as fundamental analysis, technical patterns, and behavioural finance that can influence price trends. This misconception may cause traders to overlook potential opportunities for strategic analysis.
What Are the Criticisms of Random Walk Theory?
Critics argue that markets display patterns, inefficiencies, and behavioural biases that contradict pure randomness. Studies on momentum, mean reversion and liquidity effects show that past price movements do influence future trends.
This article represents the opinion of the Companies operating under the FXOpen brand only. It is not to be construed as an offer, solicitation, or recommendation with respect to products and services provided by the Companies operating under the FXOpen brand, nor is it to be considered financial advice.

Microsoft: Progress!Microsoft successfully completed the magenta wave (2) and made further progress during the subsequent wave (3). Imminently, this wave (3) has some more room to rise, and after a temporary pullback in the following wave (4), the price should eventually overcome the resistance at $456.16. On the other hand, our 31% likely alternative scenario envisions a new low for the green wave alt. and would include a detour below the support at $348.18. Primarily, we consider the regular wave as already completed (in our previous Target Zone).

Microsoft (MSFT) Becomes the World’s Most Valuable CompanyMicrosoft (MSFT) Becomes the World’s Most Valuable Company
According to financial data, Microsoft’s market capitalisation currently stands at approximately $3.24 trillion, while the valuations of Apple and Nvidia — second and third on the list respectively — remain below $3 trillion.
This follows a sharp surge in Microsoft’s share price (MSFT), which has risen by over 26% from its April low.
Why has Microsoft’s share price risen?
The main driver behind the MSFT stock rally was last week’s quarterly report, which outperformed analysts’ expectations:
→ Earnings per share: actual = $3.46, forecast = $3.22;
→ Revenue: actual = $70 billion, forecast = $68.4 billion.
As reported in the media, investors responded positively to a notable increase in revenue from Azure cloud services.
Technical Analysis of Microsoft (MSFT) Shares
A wide bullish gap — over 7% — pushed the price above a key support line that had underpinned the 2024 uptrend in Microsoft stock.
However, following the report’s release, the price stabilised just below a resistance line drawn through previous key highs.
This provides grounds to interpret the current setup as a symmetrical triangle pattern with an axis around the $427 mark, suggesting short-term price consolidation within the defined boundaries.
Going forward, further key news related to Microsoft — a company less exposed to trade war impacts than Apple — could:
→ help maintain its status as the world’s most valuable firm;
→ support a potential bullish breakout through the resistance line and a continuation of the 2024 uptrend.
This article represents the opinion of the Companies operating under the FXOpen brand only. It is not to be construed as an offer, solicitation, or recommendation with respect to products and services provided by the Companies operating under the FXOpen brand, nor is it to be considered financial advice.

$MSFT BEST TRADE EVER? SUB $400 incoming by Mid JuneHey everybody, I hope that rally didn't kick your arses the way it did mine. You know, it's like I'm allergic to taking upside atm due to how bearish the MACRO is. Of course, with time, I'm going to assume I get most of my downside Price Targets in the next several years.
If you refer to the previous 23% Run to the 200DMA from the 50day in 2023 , NASDAQ:MSFT produced a 9 COUNT SELL SIGNAL , RALLIED for a week, and then dropped to new lows. That is what I am expecting here.
NASDAQ:MSFT looks absolutely ripe for the taking. We just rallied 17% and got the 9 COUNT SELL SIGNAL . Mind you, Gaps galore below. The Monthly and the Weekly both have Gaps . Charts do not like that, let me tell ya. I'm excited if you can't tell. NASDAQ:META and NASDAQ:AVGO look great as well. I'm still cautious about a spike out but I figure if we continue higher, i will have opportunity to grab more for cheaper as I am very confident in this move. The price moved above the DEATH CROSS and above the 200DMA . Not ever a healthy move if it moves Vertically from the 50 day and Crosses above both MA's without a stop. Mid June NASDAQ:MSFT should be at new lows.

$MSFT AI & CLOUD COMPUTING GROWTHAs of March 12, 2025, Microsoft Corporation (MSFT) is trading at $383.08, reflecting a modest increase of 0.69% from the previous close.
Despite recent market volatility affecting major technology stocks, several factors underscore a bullish outlook for Microsoft's stock:
Microsoft continues to demonstrate strong financial health, maintaining robust cash flows and a solid balance sheet. This financial stability enables ongoing investments in research, development, and strategic acquisitions, positioning the company for sustained growth.
Microsoft's significant investments in artificial intelligence, including its partnership with OpenAI, position it to capitalize on the growing enterprise demand for AI services. Analysts believe that the current stock price may undervalue Microsoft's strong fundamentals and potential in the AI market.
Microsoft's extensive range of products and services, from its dominant position in desktop operating systems and productivity software to its growing cloud computing platform, provides multiple revenue streams. This diversification enhances the company's resilience against sector-specific downturns.
Microsoft's position as a leader in the technology sector, coupled with its strong brand recognition, offers a competitive advantage. The company's ability to set industry trends and command premium pricing supports robust profit margins and market share.
Microsoft's solid financial foundation, strategic investments in AI, diversified product portfolio, and strong brand equity contribute to a positive long-term outlook for MSFT stock.
