MSTR trade ideas
Moving down to 35310This channel is not providing individualized trading or investment advice, nor is it a banking service, brokerage service, trading service, investment service or money management service.

MSTR looking very fragile....hope it doesn't break (It will!)Let's recap: BTC is really high mostly on speculation and MSTR has been running for a month with highs hitting upper acceleration band. Saylor keeps telling the market that he will continue buying at the top (with other people's money!). What could ever go wrong! Gravity will prevail and profit takers will do what they do best.
Be careful out there! MSTZ could be an interesting play (inverse). Always do your due diligence!

$MSTR ONCE IN A LIFETIME MY BEST YETLong on the 618 Fibonacci at 236 this was one of my best plays this year
I am looking for some sort of pull back to potentially RE LOAD here for another huge leg into 420-500
Drop a LIKE if u played this one with me OR want the next setup LIVE lets do this!

MICROSTRATEGY: Big 1W MA50 rebound targeting $845 at worst.MicroStrategy is on excellent bullish technicals on its 1D outlook (RSI = 67.412, MACD = 25.350, ADX = 58.097), capitalizing on the double bottom rebound on the 1W MA50 four weeks ago. Technically that was also a HL bottom on the 2 year Channel Up. The minimum rise it delivered on a bullish wave was +263.38%. Based on that, the trade is long, TP = $845.
## If you like our free content follow our profile to get more daily ideas. ##

MSTR Bull Trap!In my BKC charting, I’ve identified a pattern I call "tight! tight! tight!" typically paired with a bull trap. Prices surge as traders FOMO in, then collapse. It’s a straightforward trade: enter on the breakdown, set a stop above the prior high. Offers solid risk/reward.
Click like, follow, subscribe! Let me help you navigate these crazy markets. Lets get to 5,000 followers,

I think were due for bad earnings reaction for once.As seen in the chart, we are at the top of the range with highly over extended price movement and hitting the largest target number at $400 which has been sought after for months.
I think a snap down to $360-$350 is inevitable.
If we do pop up to $420+ then its a blow off top unless market reacts positively to government involvement to crypto.
MSTR–Institutional Bitcoin Proxy with Conviction and Leverage ₿Company Snapshot:
MicroStrategy NASDAQ:MSTR remains the largest corporate holder of Bitcoin, positioning itself as a leveraged equity proxy for BTC exposure—while still operating a profitable enterprise software business.
Key Catalysts:
Massive Bitcoin Treasury Strategy 💰
Recently acquired $1.42 billion in BTC, reinforcing commitment
Total holdings exceed 200,000 BTC, making it the most visible and transparent institutional crypto holder
Acts as a high-beta vehicle for Bitcoin bulls, especially as ETF flows drive demand
Financial Engineering = Firepower for More BTC 🚀
$722 million in refinanced fixed-income notes, lowering costs and extending maturity
Provides capital flexibility to accumulate BTC at opportunistic levels
Reflects strong capital market access and investor confidence
BTC ETF Tailwind + Institutional Validation ✅
Bitcoin ETFs provide broader adoption and liquidity, indirectly benefiting MSTR
MSTR offers a regulated, equity-based alternative to direct BTC ownership
Ideal for funds restricted from holding digital assets directly
Dual Business Model Stability ⚙️
Core enterprise software business contributes revenue and operational stability
Reduces perceived risk relative to pure-play crypto companies
Investment Outlook:
✅ Bullish Above: $325.00–$326.00
🚀 Upside Target: $490.00–$500.00
🔑 Thesis: High-conviction BTC accumulation + balance sheet optimization = leveraged upside for Bitcoin-focused investors
📢 MSTR: The go-to equity for institutional Bitcoin exposure—with built-in leverage and transparency.
#Bitcoin #MSTR #CryptoStocks #DigitalAssets #MichaelSaylor #InstitutionalCrypto

MSTR heads up at $357: Double Fib that may be Strong Resistance MSTR getting a nice boost from the Bitcoin surges.
Nearing a Double Fib that may be strong resistance.
Look for clean Rejection or Break-n-Retest for entry.

MSTR - Next Wave UpJust made a new high.
That is likely a clue of what happens next with Bitcoin.
It was a running 3 wave 1:0.618 Golden Window correction.
That is a weak ratio and ideal for a continuing uptrend.
But most importantly it was a re-test for support:
That dip buy was there to be gobbled up.
If you didn't see it then this probably goes up and up from here 👍.
Not advice

$MSTR regretting the missed shortJust steadily up the last month. Reversal candles coming in. Wish I had puts. I’m an idiot. Retrace to $350-$360.

Hello all investorsHello all investors, as u can see now the media wants u to believe there will be a recession and everything is bad; and once again im here to tell you that the opposite will happen once again like always.
The media is here to scare you out of ur positions and the banks buy the shares off of you, the media is full of con arists and they bring fake billionares on their shows to bribe you into buying shit, hold onto ur shares of Microstrategy and dollar cost average into this gem; Microstategy is a monster forever like Nvidia, Metaplanet.
Could you imagine if someone tried to tell someone to sell their gold in the start of the gold standard days because a little downturn is around the corner???? Microstrategy isnt going anywhere and bitcoin is going to become the new gold (already is) boomers still hold into gold and newgen investors buy bitcoin.

Strategy $MSTR hits resistance, what will it do?
NASDAQ:MSTR has rebounded from the bottom fairly fast compared to other stocks and indexes. It's even performed better than Bitcoin itself. It is up about 65% from the low we set a few months ago. However it should be hitting heavy resistance now near 395-400 and above is only heavier resistance. It's time for a pullback and a breather for MSTR. Target is the Point of Control near $350, before going higher. However we could turn bullish again before reaching $350.
I personally know someone who played with fire by buying NASDAQ:MSTR options calls while it was dropping before, meaning he was trying to catch a falling knife and got burnt finally. He lost nearly $500,000 because of it. So I don't mess with options personally, however I will margin trade with stocks and trade futures, forex and leverage trade cryptocurrencies.

“MSTR Bullish Setup Reminder: Watch for Breakout Above $401”✅ Bullish Summary – MSTR Daily Chart
Pattern: Inverse Head & Shoulders (bullish reversal)
Trend: Bullish momentum confirmed by Heikin Ashi candles and EMA alignment
Key Resistance: $401.95 (neckline – breakout trigger)
Support Levels: $372, $347, $254
Targets: $480 (short-term), $520–$569 (full breakout projection)
Outlook: Bullish, pending confirmation above $401.95
🔔 Reminder Note :
Let this serve as a key reminder.
🚨 Bearish Risk Levels :
A rejection at $401 without a confirmed close could lead to a pullback toward $372 or EMA clusters.
Breakdown below $347 invalidates short-term bullish setup and returns price to range.

MSTR: "Digital Gold" My A** – It's Just Bitcoin with Management Let's call it what it is: a glorified Bitcoin ETF with Michael Saylor as the mascot.
And right now? It's the Titanic with laser eyes.
🚨 Price action looks like a failed breakout.
RSI is rolling over.
Volume on the last bounce? Weak.
And guess what: BTC can go sideways for 2 months and MSTR will still bleed.
Why? Because the leverage cuts both ways.
Oh, and that "institutional demand" narrative?
Yeah… check the chart. Institutions take profit — they don’t diamond hand your hopium.

MSTR TRADE IDEALooking to play a pullback into last weeks .5/.618 fib retracement in confluence with the swing high Anchored VWAP for ideal entry.

Price target is still $420 ishPrice target is still $420 ish, there must be an upside until 1st of May, when MSTR will show earnings & revenue. I expect to be lower than estimated and price will start dropping for a while. So I am confident until 1st of May that price will go up. This is my opinion, I am not an expert and this is not financial advice.

price broke bullish flag, next target is 424 dollarsI hope it hits that target of 424. we can't see higher ath if btc doesn't beat ath. Anyway, I will sell most of share at 424. 2026 will begin the new bear market, so will cash up as much as I can.
---- not financial advice ----

Strategy in SatoshisHere, I aim to show Strategy and what looks like a breakout of descending overhead. It should start to move move vis a vis BTC - double BTC’s movement, and then triple it when it really starts moving.

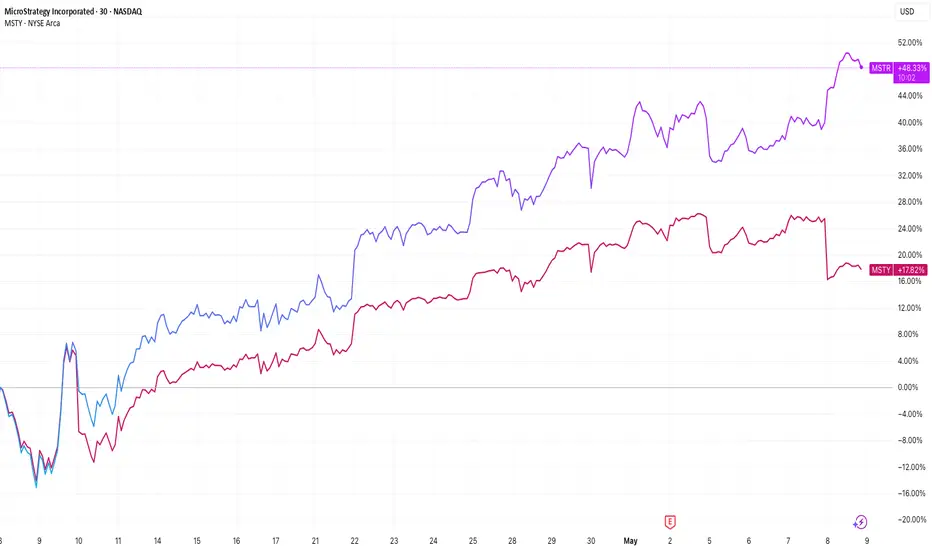
MicroStrategy on the Brink? $5.9 Billion Bitcoin Losses and MassIn Q1 2025, Strategy reported a staggering $5.91 billion unrealized loss on its Bitcoin holdings, primarily due to a significant drop in Bitcoin's price. Consequently, the company's stock plummeted by 6.3% following the announcement and has declined 41.9% since November 2024, underperforming both Bitcoin and the S&P 500 .
The Financial Accounting Standards Board's (FASB) new guidelines now allow companies to reflect the real-time market value of their digital assets. While this benefited companies like Tesla, it poses a significant risk for Strategy. With billions in unrealized Bitcoin gains, the company could face a substantial tax bill under the Corporate Alternative Minimum Tax introduced by the Inflation Reduction Act. This tax, set at 15%, could result in billions in liabilities starting in 2026, potentially forcing Strategy to liquidate some of its Bitcoin holdings to meet tax obligations .
Despite its significant Bitcoin holdings, Strategy's market capitalization stands at about $95 billion, double the value of its Bitcoin assets (currently around $50 billion in BTC). This discrepancy suggests that investors are paying a hefty premium for exposure to Bitcoin through Strategy, rather than purchasing the cryptocurrency directly or through other financial instruments. Analysts warn that this overvaluation could be unsustainable, especially if Bitcoin's price experiences further volatility .
Strategy's approach of continuously issuing debt and equity to fund Bitcoin purchases has been likened to a high-risk financial flywheel. Critics argue that this strategy is unsustainable and could collapse if Bitcoin's price declines or if the company faces regulatory scrutiny. Furthermore, co-founder Michael Saylor's past controversies, including a $40 million tax fraud settlement, add to the ethical concerns surrounding the company's leadership .

MSTR.....down down she goes (MSTZ inverse!)MSTR just hit the top of the Bollinger band and all the hot air is coming out (quickly). Let's see where this lands, but nice to time to load up on MSTZ IMHO.....
Best of luck and always do your own due diligence!

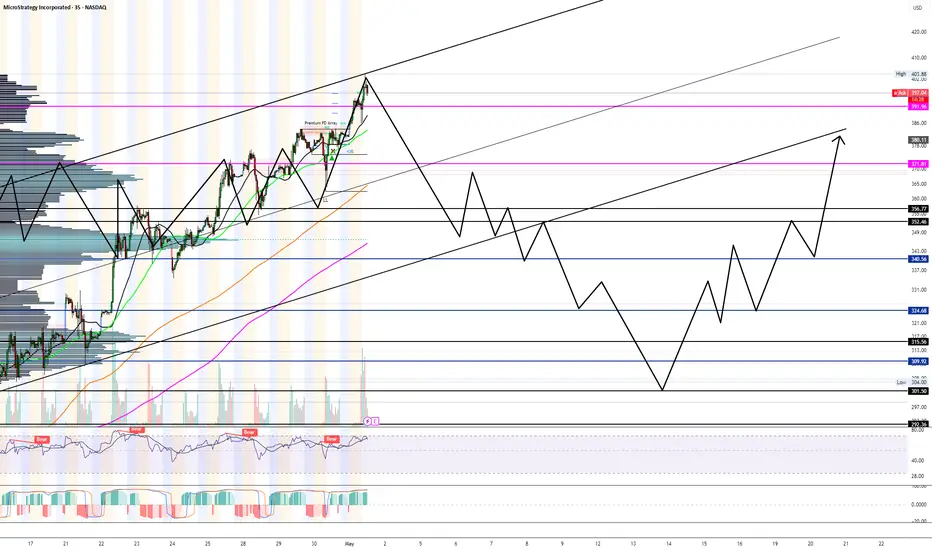
MicroStrategy Ignites Major Breakout Could Send Prices Soaring📈 MicroStrategy (MSTR) 4H Technical Analysis
MicroStrategy ( NASDAQ:MSTR ) is exhibiting a strong breakout structure on the 4-hour timeframe, signaling potential continuation to the upside.
Breakout Confirmation
Price action has decisively broken above the descending trendline that had acted as resistance since March.
A successful retest of the breakout level around $340-$350 strengthens the bullish case.
Key Support and Resistance Levels
Immediate support zones: $341.26 and $338.24
Deeper support: $317.48 and $301.46
Upside resistance targets : $435.76 initially, with an extended target toward $455.10 if momentum persists.
Risk-Reward Outlook
The setup offers a favorable risk-to-reward ratio, exceeding 2:1.
Well-defined risk parameters below recent support provide a clear invalidation point.
Volume and Momentum
Breakout is supported by increasing volume, confirming strong buying interest.
Momentum indicators on higher timeframes continue to tilt bullish, suggesting further room for upward movement.
Macro Context
With MicroStrategy’s heavy exposure to Bitcoin, any strength in the cryptocurrency market could act as a catalyst for continued gains.
NASDAQ:MSTR maintains above the $338–$341 support region, the technical bias remains bullish with targets set toward $435–$455. A sustained move below $317 would invalidate this outlook and shift bias back to neutral or bearish.

A confirmed breakout activates a $900 target.Whatever you might think of Michael Saylor or Bitcoin, the MicroStrategy chart is currently morphing into existence a bullish continuation pattern.
A confirmed breakout activates a $900 target.
As you can see on the chart below, not all breakouts play out the same way.
