3/27/2025 MSTR_BearishHi traders,
There’s a high probability that MSTR will move lower from here. Friday’s session will determine its direction, as the weekly candle is forming a shooting star, but getting in early isn’t a bad idea.
The BTC chart also looks bearish— the 0.618 Fib level from the previous high and low has been acting as resistance for several days. We need to watch if the 50 SMA will hold as support, but I don’t think it will, given my bearish outlook on SPY.
My target is 250 area, 200SMA will act as support.
May the trend be with you.
AP
MSTR trade ideas
MSTR is a ticking time bomb.....down downMSTR is up almost 50% from 2 weeks ago. There is very little upside at the moment, and short term investors are itching to cash out asap! Great time to get into MSTZ (inverse) before this pops ahead of next weeks new round of tariffs that will depress stocks and crypto even more.
Best of luck and always do your own due diligence!
Assortment of OTM MSTR Puts
MSTR is filling my alerts for the optimal short zone mentioned previously.
I've explained the various macro bear trend setups in MSTR previously. For some additional stuff;
Generally a correction will be two legs. When it's not, there's usually at least 4. 3 corrective legs is rarer. Breaking under might have been a bear break.
If it was, a retracement is always fair game but now we're into the zone this can be faded.
Selling calls into the rally and buying an assortment of deep OTM puts on MSTR
Put $210.00 - Last: $1.22, Bid: $1.07, Ask: $1.21, Vol: 44.0, IV: 115.0%, OTM
Put $205.00 - Last: $1.09, Bid: $0.98, Ask: $1.12, Vol: 53.0, IV: 118.4%, OTM
Put $215.00 - Last: $1.27, Bid: $1.16, Ask: $1.34, Vol: 33.0, IV: 111.9%, OTM
Put $200.00 - Last: $1.00, Bid: $0.90, Ask: $1.04, Vol: 123.0, IV: 121.8%, OTM
Put $220.00 - Last: $1.40, Bid: $1.28, Ask: $1.40, Vol: 22.0, IV: 108.3%, OTM
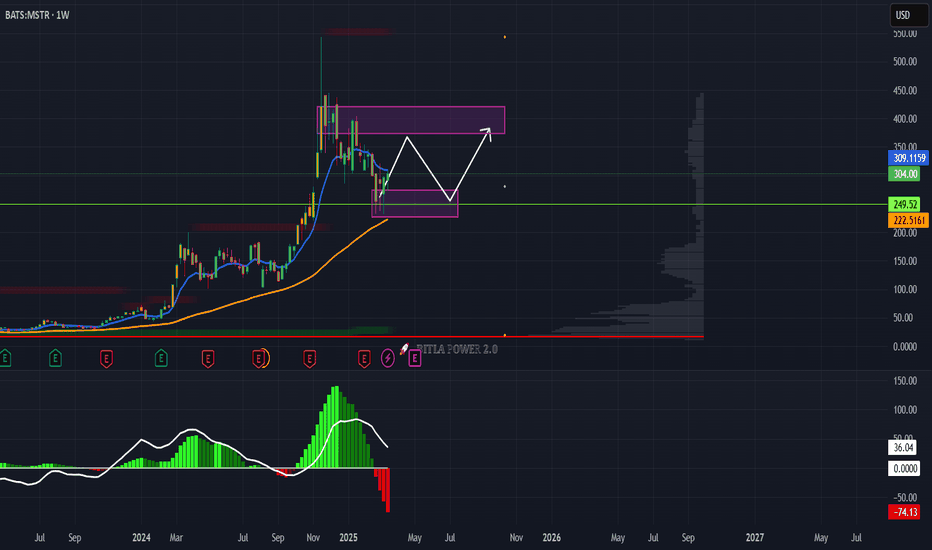
MicroStrategy To $370?Hello friends! I'm back with an analysis of MSTR. As we can see, the price had a significant drop of 57% from November 2024 to March 2025. The price is highly correlated with Bitcoin, and said cryptocurrency is in a wave 4 within an Elliott wave pattern. Therefore, Bitcoin will be returning to test $110,000. Therefore, MSTR, holding 499,096 bitcoins, will see a very significant rise in its price. In the short term, MSTR will be going to test its luck at $370 per share. However, it is highly likely that it could return to $410 per share. MSTR has many technical and fundamental indicators in its favor to be a highly profitable value asset. The best buying zones are below $300 per share.
Disclaimer: This is only an opinion; it should not be used as investment advice or recommendation.
MSTR...to $260Downward channel, lower lows and lower highs. What else do you need to see? Oh, a ponzi model that is based on selling high volatility digital coins to unsophisticated retail investors. High chance of MSTR dipping to mid $200s esp. with this crappy economy. Leverage MSTZ (inverse) to profit from this!!
Best of luck and always do your own due diligece!
MicroStrategy, IncStock traders may advise shareholders and help manage portfolios. Traders engage in buying and selling bonds, stocks, futures and shares in hedge funds. A stock trader also conducts extensive research and observation of how financial markets perform. This is accomplished through economic and microeconomic study; consequently, more advanced stock traders will delve into macroeconomics and industry specific technical analysis to track asset or corporate performance. Other duties of a stock trader include comparison of financial analysis to current and future regulation of his or her occupation.
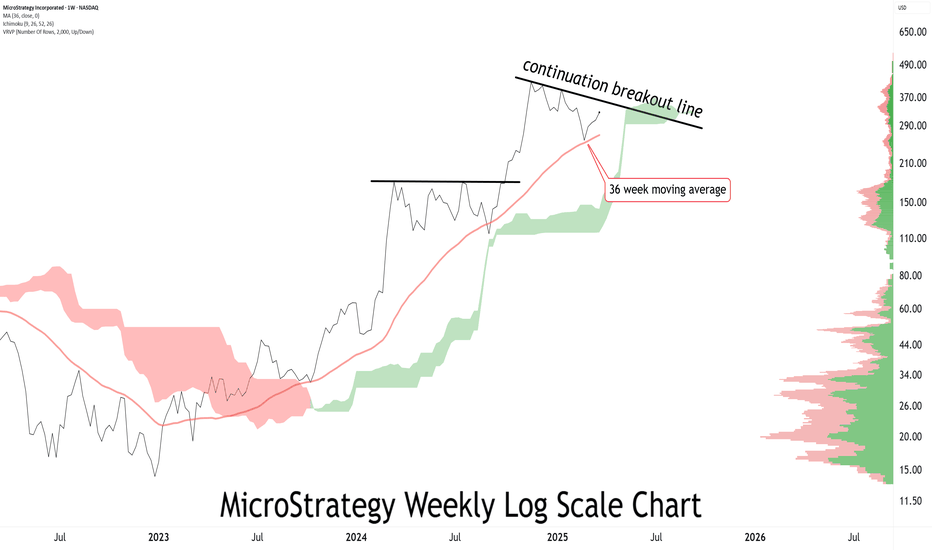
MSTR: Is 300 Enough?MicroStrategy is seeing tremendous strength off the lows along with the rest of the crypto space. We are eyeing this 300 level to see if it offers a proper buy zone to coincide with Bitcoin 85,000 which has also seen tremendous outperformance relative to equities. Watch the overhead trendline drawn here as well as Bitcoin 90,000 for profit takes or continuations. We will decide which if and when we get there.
Falling Wedge?The triangle correction seems mostly invalidated, but not entirely. However, it looks like a falling wedge might be forming instead.
In the short term, we should expect to see $275 – $287 as a potential target. If the falling wedge plays out, we might get a breakout to the upside. Let’s see how the price reacts! 🚀


