BearishI have a feeling that Micron's gonna retest $109 or blow through it and run for the 200 moving average. Waiting to see a bullish divergence in the RSI, or for it to get out of this little downtrend it's forming
MU trade ideas

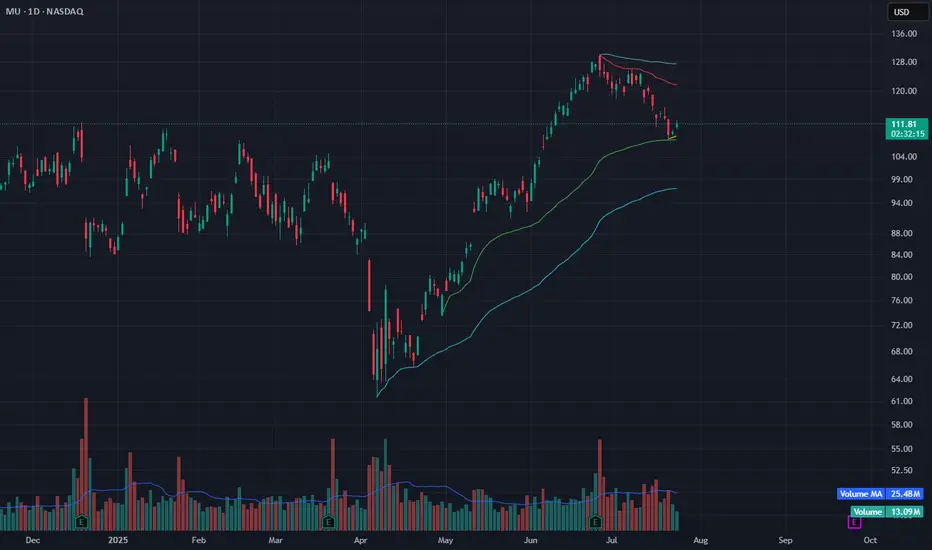
MU Bounce at VWAP Support – Eyeing Relief Toward $118MU is showing signs of a potential reversal after a multi-week pullback. Price held the anchored VWAP zone (green line) near $109 and bounced today with a +1.83% move on 13M volume.
This level also aligns with the lower Bollinger Band — a common mean-reversion setup after extended downside. A short-term bounce toward $118–120 could be in play if the move gains momentum.
Volume is below average but stabilizing. Price must stay above $109 for this bounce to hold.
Indicators used:
Anchored VWAP (support zone)
Bollinger Bands (oversold structure)
Volume + Volume MA (momentum context)
Entry idea: Bounce confirmation above $112
Target: $118–120
Stop: Below $109
New Setup : $MUThe hourly chart sees a bullish crossover, bullish ATR Break, and Bullish Price Action already out.
Ready To catch it

MU WEEKLY TRADE IDEA (2025-07-29)
### 🚀 MU WEEKLY TRADE IDEA (2025-07-29)
**Micron Technology (MU) – Bullish Call Play**
🔹 **Sentiment:** Moderate Bullish
🔹 **C/P Ratio:** 2.91 (Bullish Flow)
🔹 **RSI (Weekly):** 53.6 📈
🔹 **Volume:** Weak (⚠️ caution — low conviction)
---
### 🎯 Trade Setup
* **Strike:** \$116.00
* **Type:** CALL (LONG)
* **Expiry:** 2025-08-01
* **Entry:** \$0.62
* **Target:** \$0.89
* **Stop:** \$0.31
* **Risk:** 2–4% of account
* **Confidence:** 65% 🧠
* **Entry Timing:** Market Open
---
### 🤖 Multi-Model Consensus
5 AI Engines Agree:
✅ Buy \$114–\$116 Calls
🧠 Models: Grok, Gemini, Claude, Llama, DeepSeek
📉 Main Risk: Weak volume divergence despite strong options flow
---
### ⚠️ Key Notes
* 📊 Institutional call buying ✅
* ⚠️ Low volume = reduced confirmation
* 🎯 Play is short-dated — gamma spikes expected
* 💥 Manage exits actively near target zones
---
### 🧠 Quick Recap (for speed-readers)
**MU 116C ➜ \$0.62 → \$0.89**
💥 Weekly flow supports upside
⚠️ Volume = weak, but RSI rising
⏱️ Hold short-term with stops

MU eyes on $95/97: Double Golden fib zone Ultra-High GravityMU looking to exit a Double Golden zone $95.33-97.23
Break could pop to next resistance zone $109.41-111.38
Expecting some orbits around this ultra high gravity zone.
.
Previous Plot that caught the bottom EXACTLY:
==================================================
.

$MU – Preparing for Institutional Flow Reversal?📈 NASDAQ:MU – Preparing for Institutional Flow Reversal?
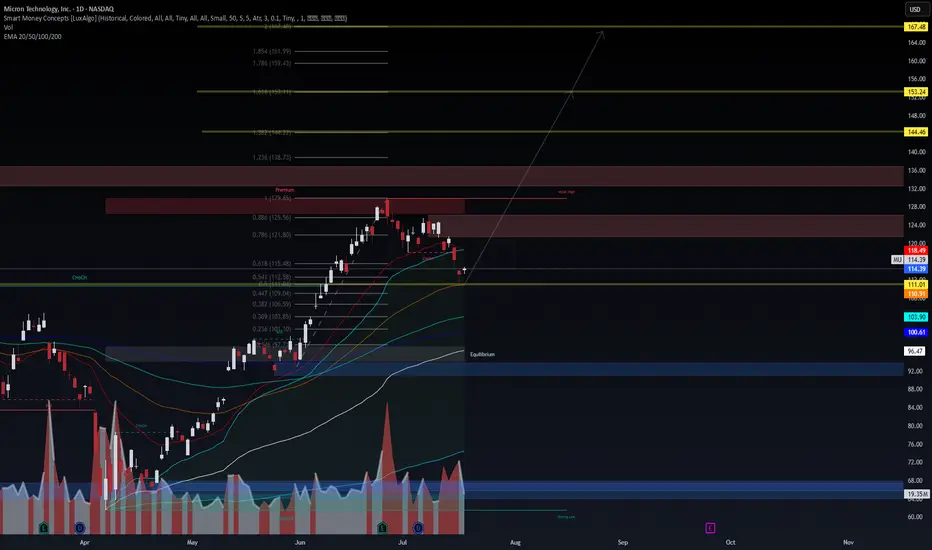
Micron ( NASDAQ:MU ) is at a crucial confluence zone, holding just above the 0.618 retracement ($115.48) after a CHoCH breakdown. With EMAs (20/50/100/200) aligning under price, the technical setup hints at an early-stage liquidity grab before potential expansion.
🔹 Technical Outlook
Current price: $114.39
CHoCH confirmed near premium zone ($129–$138)
Rejection from 0.886 Fibonacci zone ($125.56)
Holding above major EMAs (Support: $110.91 / $111.01)
Volume spike suggests accumulation at equilibrium ($100–$103)
🔹 VolanX DSS Probability Scenarios
LSTM-GRU model predicts price recovery toward $135–$140 by late August
Short-term risk zones: $108.67 stop loss (weekly), upside target $124.69
1W Neural Forecast: +5.9% upside bias, confidence skewed toward recovery
VaR (99%): -8.68% max drawdown exposure
🔹 Macro & Risk Consideration
Semiconductor cyclicals are catching tailwinds from AI infrastructure demand
Risk: High beta and earnings volatility; monitor inflation & Fed communication
Volatility: 52.4% annualized – risk remains elevated
🔹 Strategic Play (Not Financial Advice)
Entry Zone: $111–$114 (support + VWAP alignment)
SL: $108.67 (below weekly structure)
TP Zones: $124.69, $138.73, $153.24 (Fib levels)
💡 “We don’t trade the price, we trade the narrative. Follow the Smart Money—ride the VolanX Protocol.”
#Micron NASDAQ:MU #TradingView #SMC #LSTM #AITrading #SmartMoney #TechStocks #Fibonacci #OptionsFlow #VolanX #WaverVanir #MarketIntel #InstitutionalTrading #ProbabilityBasedTrading
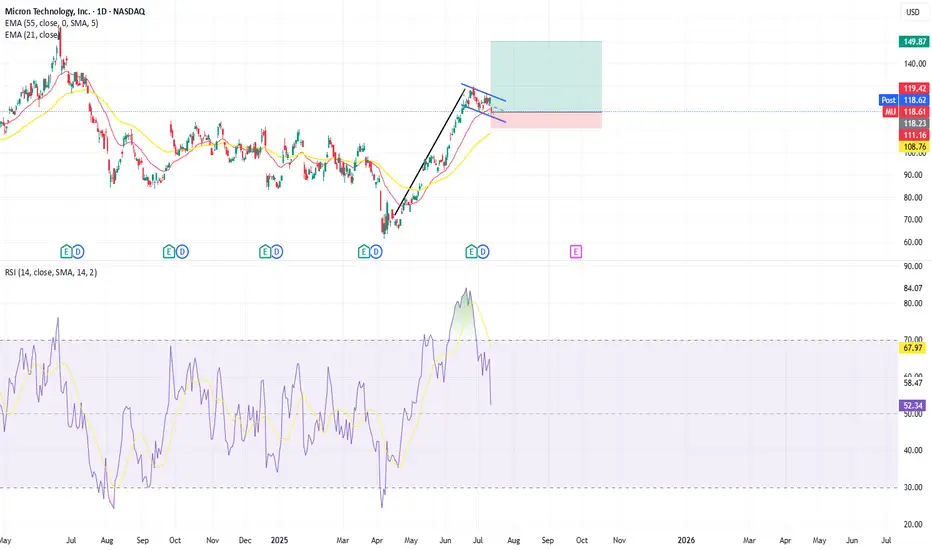
Bullish flag Pattern on MUIt appears there is a Bull flag occurring in MU. Weve seen an 82% rise since the lows caused by the market drop in April and our now seeing a slight retraction back into the 21 EMA. Price is currently at 118.6 with some support at the 114 level. Using a Stop Loss just below this support level should it break and using the first target of 150, just below all time highs yields a risk reward ratio of 1:4.5.
Micron Technology - Another +50% rally will follow!Micron Technology - NASDAQ:MU - will rally another +50%:
(click chart above to see the in depth analysis👆🏻)
About two months ago Micron Technology perfectly retested a confluence of support. This retest was followed by bullish confirmation, nicely indicating a reversal. So far we saw a rally of +100%, but looking at the channel pattern and previous cycles, another +50% will follow.
Levels to watch: $200
Philip (BasicTrading)
#LONGTERMVISION

MU - SMC Premium Zone Rejection | Targeting Equilibrium Before E📉 MU - SMC Premium Zone Rejection | Targeting Equilibrium Before Expansion
🔍 WaverVanir DSS Framework | SMC x Fibonacci x Liquidity
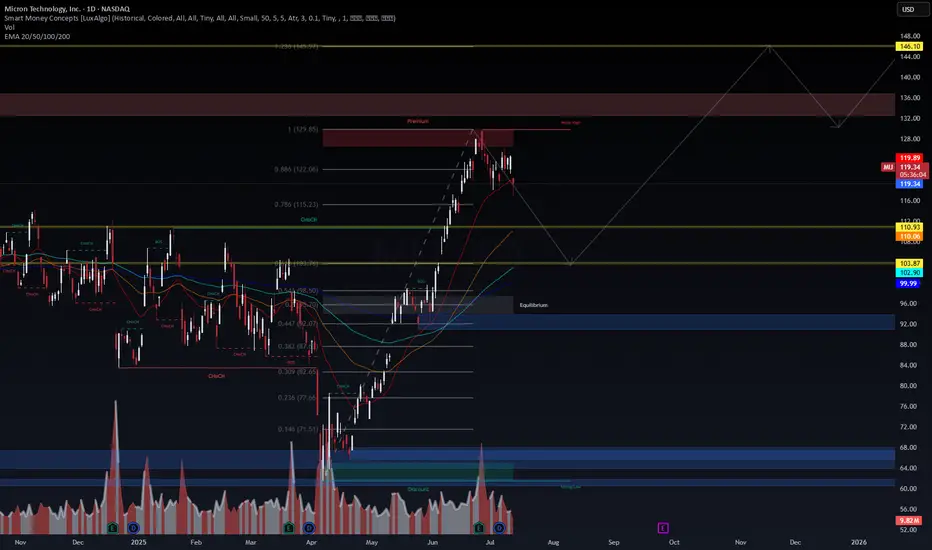
We just observed rejection from the Premium zone and 0.886 Fibonacci retracement near $129.85, aligning with prior weak high liquidity. Price has shown signs of distribution, with a likely retracement to the Equilibrium zone ($98–$103) before any bullish continuation.
🧠 Key Observations:
ChoCH confirmed post-run to premium → Expect redistribution
Price rejected 0.886 (122.06) and weak high near 129
Strong EMA confluence forming around 110–103 range
Equilibrium zone and volume spike near $98–$103 offers valid demand
Long-term target remains open toward Fib extension @ $146.10, but only after deeper retrace
📉 Short Bias Until $103–$98 Demand Zone
🔁 Then flip long if bullish confirmation appears
📊 VolanX Market View:
Structure: Breaker → ChoCH → Premium Rejection
Bias: Retracement → Reaccumulation
Tools Used: Smart Money Concepts, Fib, Volume, EMA stack, Liquidity zones
🧠 Built using the WaverVanir DSS, designed to navigate institutional flows and macro-infused setups. We’re tracking this sequence closely across cycles.
📅 Chart Date: July 14, 2025
📍 Asset: NASDAQ:MU (Micron Technology Inc.)
💬 Follow @WaverVanir for macro-aware, alpha-focused setups.
📈 Disclaimer: Not financial advice. Educational content only.
#SMC #OptionsFlow #FibLevels #LiquidityZones #WaverVanir #VolanX #TradingView #MU #Micron #TechStocks #InstitutionalTrading #VolumeProfile #ChoCH #Equilibrium #SmartMoney
Micron Technology Inc.: Optimistic Long-Term Outlook Driven by ACurrent Price: $124.53
Direction: LONG
Targets:
- T1 = $128.50
- T2 = $130.00
Stop Levels:
- S1 = $123.00
- S2 = $120.00
**Wisdom of Professional Traders:**
This analysis synthesizes insights from thousands of professional traders and market experts, leveraging the collective intelligence to identify high-probability trade setups. The wisdom of crowds principle suggests that aggregated market perspectives from experienced professionals often outperform individual forecasts, reducing cognitive biases and highlighting consensus opportunities in Micron Technology Inc.
**Key Insights:**
Micron Technology Inc. (MU) remains a leading semiconductor company well-positioned to benefit from AI-driven demand for high-bandwidth memory, a key growth catalyst in the sector. Despite broader sector challenges with technical divergences, a break above the $130 resistance level could signal continued bullish momentum, while holding the $120 support level is critical to avoid triggering downside risks. Investors should carefully monitor price movements and geopolitical developments for directional cues.
**Recent Performance:**
Micron has traded within a tight range recently, reflecting a period of consolidation as investors weigh AI growth prospects against broader semiconductor market uncertainties. The stock has demonstrated notable relative strength, supported by positive macroeconomic trends. However, it remains vulnerable to external pressures, such as tariffs and concerns over China's economic stability.
**Expert Analysis:**
Industry experts project strong long-term demand for semiconductors driven by AI applications, with Micron benefiting from its leadership in memory technology. Optimism is underpinned by growing investments in data centers and cloud computing. Nevertheless, analysts urge caution due to potential near-term headwinds stemming from technical signals, geopolitical challenges, and macroeconomic factors such as demand fluctuations.
**News Impact:**
Reports of China's economic slowdown and upcoming policy decisions could significantly influence Micron’s short-term price movements. Additionally, developments related to tariffs and supply chain dynamics remain pivotal for assessing risks. The overarching AI growth story continues to be a key driver of optimism, which bolsters the long-term outlook for Micron’s growth narrative.
**Trading Recommendation:**
In light of Micron’s strong positioning in AI-driven markets, traders may consider a LONG position, with an entry at current levels ($124.53) and initial targets set at $128.50 and $130.00. Stops should be set conservatively at $123.00 and $120.00 to safeguard against downside risks. Carefully track any geopolitical or macroeconomic developments that might affect the broader semiconductor sector.
Micron going downMy predictions are not investment advises. Do your own analysis..I am not responsible for your losses..
The price drop will probably start tomorrow or next week...It will take some time to reach the target area...

MU bulls are out for blood!boost and follow for more ❤️🔥 MU had a very bullish break of trend resistance/ALL simple move average resistance that were previously holding it back. Now bulls took back control and are out for blood.. on the big dip earlier this year you can see resistance from 2022 acted as its new bottom/support. this was my buy signal and why I entered 🤝✅
added shares here @64.89, almost up 100%+ on those but I think I push higher to 150 will come soon.🎯

Micron Technology - Starting the next +80% move!Micron Technology - NASDAQ:MU - perfectly respects structure:
(click chart above to see the in depth analysis👆🏻)
Starting back in mid 2024, Micron Technology created the expected long term top formation. We witnessed a correction of about -60%, which ultimately resulted in a retest of a confluence of support. So far, Micron Technology rallied about +60%, with another +80% to follow soon.
Levels to watch: $150, $180
Keep your long term vision!
Philip (BasicTrading)

Micron Technology (MU) – Powering the AI Memory SupercycleCompany Overview:
Micron NASDAQ:MU is a crucial player in the AI infrastructure stack, providing advanced DRAM, NAND, and NOR flash memory solutions that fuel everything from data centers to mobile edge devices.
Key Catalysts:
AI-Driven Memory Demand ⚙️
High-Bandwidth Memory (HBM) adopted in AI accelerators from Nvidia, AMD, Broadcom, and Marvell.
Positions Micron at the core of the AI supply chain, reducing exposure to chip cycle volatility.
Data Center Surge 📈
Data center DRAM revenue tripled YoY in Q2 2025, driven by hyperscaler AI infrastructure upgrades.
Strengthens revenue diversification and margin profile.
Technology Leadership 🔬
Launch of 1-gamma DRAM node and LPDDR5X samples enhances mobile, cloud, and auto capabilities.
Keeps Micron on the cutting edge of memory innovation.
Investment Outlook:
Bullish Case: We remain bullish on MU above $95.00–$97.00.
Upside Target: $155.00–$160.00, supported by AI compute growth, hyperscale momentum, and next-gen product launches.
💡 Micron is not just riding the AI wave—it’s building its memory core.
#Micron #MU #Semiconductors #AI #HBM #DataCenter #DRAM #NAND #Nvidia #AMD #Hyperscalers #TechLeadership

MU Options Insight: Bulls Eyeing $123Fundamental Overview
Micron Technology's $200 billion expansion plan aligns with the broader push for domestic semiconductor manufacturing. The company is investing $150 billion in fabrication plants across Idaho, New York, and Virginia, while $50 billion is allocated for high-bandwidth memory packaging and R&D. This move strengthens Micron’s position in AI-driven demand and supply chain resilience.
The CHIPS and Science Act funding of $6.4 billion and eligibility for the Advanced Manufacturing Investment Credit further bolster Micron’s financial outlook. CEO Sanjay Mehrotra emphasized that this expansion will create tens of thousands of jobs and reinforce U.S. tech leadership.
Technical Analysis
Micron’s stock is currently near a 12-month high, up 37% year to date. The momentum remains strong, with institutional activity suggesting bullish sentiment.
- Options Flow Insight: A vertical bull spread was spotted in Times & Sales, with 118 strike contracts executed on the ask and 123 strike contracts executed on the bid simultaneously. This suggests a bullish stance, as traders anticipate further upside.
- Expiration Consideration: The June 20 expiration (4 days away) indicates a short-term bullish outlook, likely targeting a breakout above $123.
- Institutional Positioning: The 500 additional contracts at 118 reinforce the bullish bias. If MU moves beyond $123, traders holding the spread still profit, confirming strong conviction in upside potential.

How to find pre-earnings runs weeks ahead of the actual earningsThere is far more opportunities to make higher profits BEFORE a CEO announces the Earnings Report on the public exchanges.
In this lesson, you will learn about how the Buy Side Dark Pools consult with the CEO and CFO to determine weeks ahead of the earnings season whether the report will be stellar, average, or weak.
Retail Analysts do not have access to this information and are guessing much of the time and often just state an estimate which the Corporation can easily beat or meet.
However, there are far greater profits from trading pre-earnings swing style runs of a stock.
This educational training helps you choose stocks to trade for this upcoming earnings season.
Put together a watchlist of not just big blue chip stocks, but also lesser known companies that have new technologies or services that are going to help that company grow into a big blue chip.
Pre Earnings runs start much earlier than you may think.
For a list of ALL of the companies reporting each day starting in late June or early July, go to NASDAQ.com which provides a list of all companies reporting and on what day that report is due out.
Then put together a watchlist of stocks that have charts that are showing some Dark Pool activity and pro trader activity well ahead of the earnings report date.
This is an Earnings Strategy that is excellent for Swing Trading, Momentum Trading, etc.

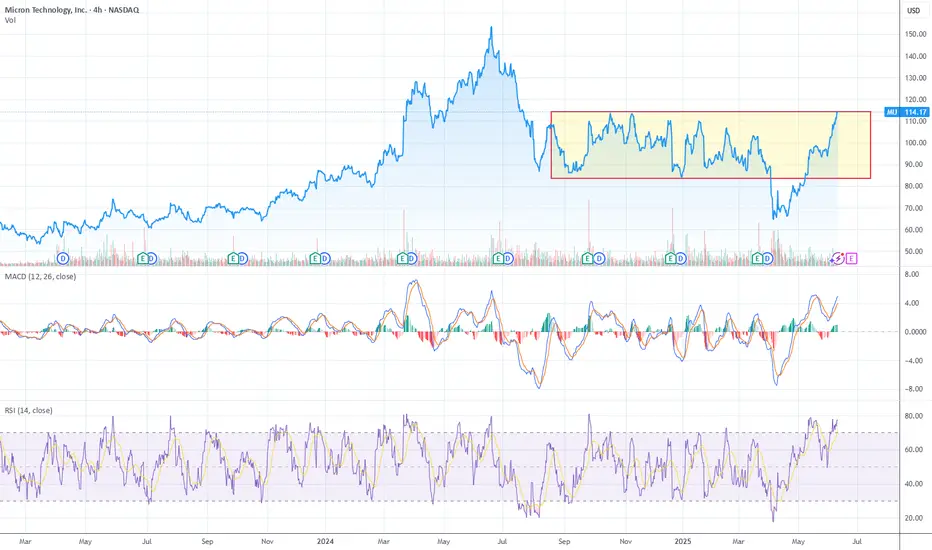
MU at the Edge: Range Break or Bull Trap?Technical Overview
1. Price Action (Range-bound, Resistance Zone)
The chart shows strong resistance around $117–$120 (highlighted in red). Price is now testing the top of this year-long horizontal range after a sharp rally off the lows (~$70).
2. RSI (Overbought Condition)
RSI is above 77 – classic overbought territory. Historically, RSI spikes above 70 near this level have preceded short-term pullbacks. Divergence is not yet confirmed, but we are at a level where previous rallies reversed.
3. MACD (Momentum Peaking)
MACD is strongly positive, but the histogram is showing signs of slowing momentum.
4. Volume (Not Convincing Yet)
Volume has not exploded on the current move up, suggesting buyer exhaustion near resistance. Previous tops around this level saw higher volume spikes, which are absent now.
What's next?
If MU (Micron Technology) cleanly breaks above the $117–$120 resistance zone on strong volume and confirms a breakout, we are no longer just playing range-bound mean reversion — we’re talking trend continuation. So let’s project what’s in it for us on the upside.
What Happens if MU Breaks Out?
1. Massive Base Breakout
The stock has been consolidating in a broad 14-month horizontal range. A breakout from such a large base is fuel for a sustained trend — “the bigger the base, the higher the space.” That means the next leg could be powerful.
2. Fibonacci Extension Targets (From Previous Peak to Trough)
Using $155 (previous high) and $65 (cycle low):
Level Price Target
1.0 (prior high) $155
1.272 ~$170
1.618 ~$185
These extensions align well with the measured move, giving confluence around $170–$185.
3. Volume Confirmation Will Matter
For this breakout to be sustainable, you’ll want to see:
Volume spike
RSI > 70 but holding
MACD broadening, not crossing down
A failed breakout would just become a bull trap.
4. Sentiment Can Add Fuel
AI/semis are already in a macro bullish narrative. A fresh breakout could trigger:
FOMO from institutions
Short covering
Options gamma squeeze
Strategy If Resistance Breaks
Buy on retest of $120 with stop just under the breakout.
Aggressive entry can ride momentum, but needs tight stop under $117.
First target: $135–140,
Mid-term: $155,
Final: $170–185 (if the full extension plays out).
“Markets move based on perception, not reality.”
A clean break above $120 changes perception entirely — from a range play to a trend breakout. If that happens with volume and conviction, you lean in, ride it, and trail stops like a sniper. Because when a stock clears a 14-month ceiling, it's not breaking out for nothing.
MU- Next potential movementsMU- Next potential movements
.
Breaking out solid ressistences, now waiting for a backtest with low supply vols.
Swinging to forming a big Inversed Head n Shoulder pattern consolidation.
See and wait.
US STOCKS- WALL STREET DREAM- LET'S THE MARKET SPEAK!

MICRON, Pushing to New ATHMICRON
Based on the chart, the uptrend is still strong and MICRON had broke the ATH (at 2000th) before in June 2024th.
The most likely will happen is, MICRON will push to a new ATH. I'm personally targeting 175-250 range based on fibonacci.
Although it still have a chance to retest the 100-90 range, but still looks very promising in the long-term.
Terimakasih.

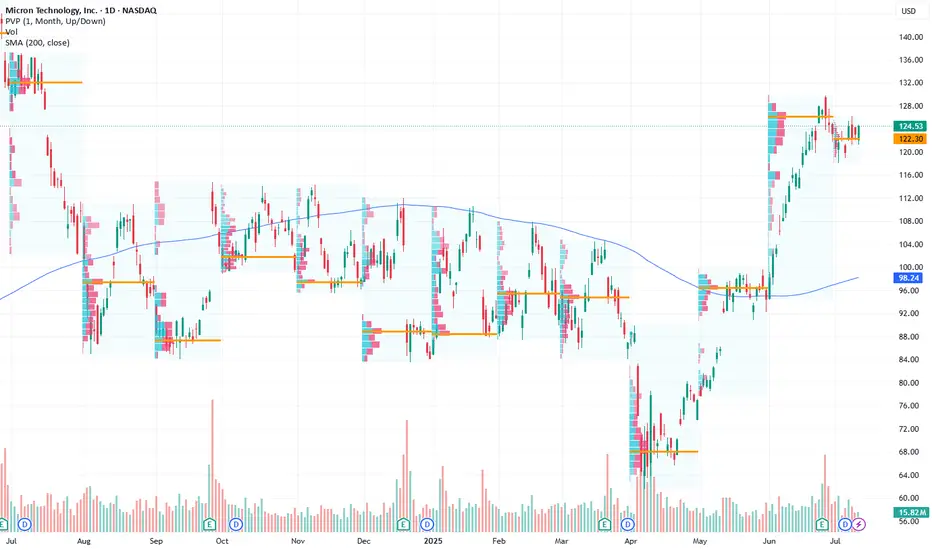
MU Monthly Chart – Support Bounce $65, Resistance at $97Micron Technology ( NASDAQ:MU ) delivered a textbook bounce in April — right off major monthly support around $65, which also aligns with a trendline dating back to 2015.
This bounce came during a broader market pullback, and NASDAQ:MU showed strength with the overall market rebounded.
Since then, price has climbed into a critical level of resistance/support at $97 — a key area to watch ahead of earnings on June 25th.
Long-term trendline support from 2015
Analyst average target: $123
TradingView rating: Strong Buy
Next resistance = $97
Major earnings catalyst in late June
If NASDAQ:MU can break and hold above $97, that opens the path toward the $120 zone. If not, we could see a retest of lower levels post-earnings.
📅 Watch how price behaves around $97 leading into earnings.

Micron pending a cup and handle break to the upsideNASDAQ:MU is looking at a strong potential reversal to the upside after completing its larger corrective three wave structure. Currently, we have a bullish cup and handle formation and there is a strong likelihood of a break above 99.05 immediate resistance.
Momentum indicator is showing strong bullish upside ranging from short to long-term. Ichimoku has shown a three bullish golden cross formation.
Near-term target is at 114.15 and longer-term target is at 170.00. Key support is at 84.00

Micron’s stock closed at $96.93: reflecting “Strong Buy”Micron’s stock closed at $96.93, reflecting a significant intraday gain of +5.03%. The technical outlook remains bullish, with consensus signals across key indicators:
Supertrend and Moving Averages reinforce a “Strong Buy” stance.
Oscillators align with bullish momentum:
RSI(14) at 71.36 (approaching overbought but supportive of upward momentum).
Momentum(10) at 20.05, Awesome Oscillator at +9.67, and CCI(20) at 205.30, all signaling sustained buying pressure.
Ultra MACD maintains a positive trajectory, contingent on continued momentum.
Fibonacci retracement identifies a critical support level at $89.00, serving as a base for upward revisions.
Fundamental Considerations
Financial Performance: Quarterly net income declined -15.35% YoY, though annual net income stands at $778M.
Balance Sheet: Net debt of $6.8B warrants monitoring, particularly in light of cyclical industry dynamics.
Market Sentiment: Fixed-range volume profile indicates diminishing participation, creating a divergence from rising price action.
Analyst Consensus & Valuation
Consensus rating: Buy (based on 28 analysts, per Refinitiv data).
12-month price target: $123.91, implying ~27.8% upside potential.
Risk-Reward Assessment
While technical indicators advocate for a long position, fundamental headwinds (e.g., margin compression, leverage) necessitate disciplined risk management. Key near-term catalysts include industry-wide DRAM/NAND pricing trends and execution on operational efficiency.

MU watch $59: Double Golden fib support that bulls MUST hold.MU bounced off a Double Golden fib zone that may get retested.
The bounce Ping'd a Golden Covid at $72.56 confirming that series.
So we watch the sister covid fibs at $67.19 and $63.86 for reactions.
