MU trade ideas

MUThis Week FORECAST
Opportunity for MU. This setup I ready for this zone to entry. >> TAYOR
Risk Factors:
1. Market conditions, unexpected news, or external events could impact the trade.
2. Always use risk management strategies to protect your capital.

MUMicron Technology, Inc. is an American producer of computer memory and computer data storage including dynamic random-access memory, flash memory, and USB flash drives. It is headquartered in Boise, Idaho. Its consumer products, including the Ballistix line of memory modules, are marketed under the Crucial brand

Micron's Path to Recovery Signals a Bullish Trend for $MU Stock
After weathering a challenging post-pandemic downturn in the memory-chip markets, Micron Technology Inc. (NASDAQ: NASDAQ:MU ) is emerging from the storm with promising indicators of recovery. The company's fiscal first-quarter earnings report reflects higher revenue, an improving gross margin, and rising average selling prices for DRAM and NAND chips. As global shipments of PCs are poised for growth in the coming year and demand for AI-computing capacity continues to rise, Micron anticipates a record year for the memory-chip industry in 2025.
A Glimpse into Micron's Performance:
Despite still facing financial losses, Micron's recent fiscal performance showcases encouraging signs. In the first quarter, the company reported a 16% year-over-year revenue growth, reaching $4.7 billion. This growth was primarily driven by robust sales of DRAM chips. Notably, DRAM bit shipments surged by over 20% from the previous quarter, accompanied by an upward trend in average selling prices. The NAND business experienced a mixed quarter, with bit shipments decreasing by a mid-teens percentage while average selling prices soared by about 20%.
PC Market Resurgence:
One key factor contributing to Micron's recovery is the anticipated return to growth in the global shipments of PCs in the upcoming year. With inventory levels across the PC supply chain stabilizing and returning to normal, Micron is well-positioned to benefit from increased demand for memory chips. As the world adapts to new work and learning paradigms, the demand for PCs is expected to rise, driving Micron's growth in the market.
Smartphone Shipments and AI-Computing Demand:
In addition to the positive outlook in the PC market, Micron stands to gain from potential growth in smartphone shipments. After a prolonged slump, the smartphone market is showing signs of revival, presenting Micron with additional avenues for revenue generation. Moreover, the relentless demand for artificial intelligence (AI)-computing capacity is expected to buoy the market for servers, further contributing to Micron's positive trajectory.
Looking Ahead to 2025:
While Micron acknowledges that 2024 will be a recovery year, the company is optimistic about the industry's prospects in 2025. Micron envisions 2025 as a record year for the memory-chip industry, suggesting sustained growth and profitability for the company. Investors eyeing the long-term potential of the semiconductor market may find Micron's forecast compelling, as the company positions itself for a robust future.
Micron's recent performance, coupled with positive industry trends, paints a promising picture for NASDAQ:MU stock. As the memory-chip market rebounds and key sectors such as PCs, smartphones, and AI continue to drive demand, Micron appears poised for a strong recovery. While challenges persist, the light at the end of the tunnel shines brighter, making Micron an intriguing prospect for investors seeking growth and resilience in the dynamic semiconductor landscape.
Technical Analysis
Micron Technology is in a rising trend channel in the medium long term. investors over time have bought the stock at higher prices and indicates good development for the company. The price has risen strongly since the positive signal from the rectangle formation at the break through resistance at 72.28.
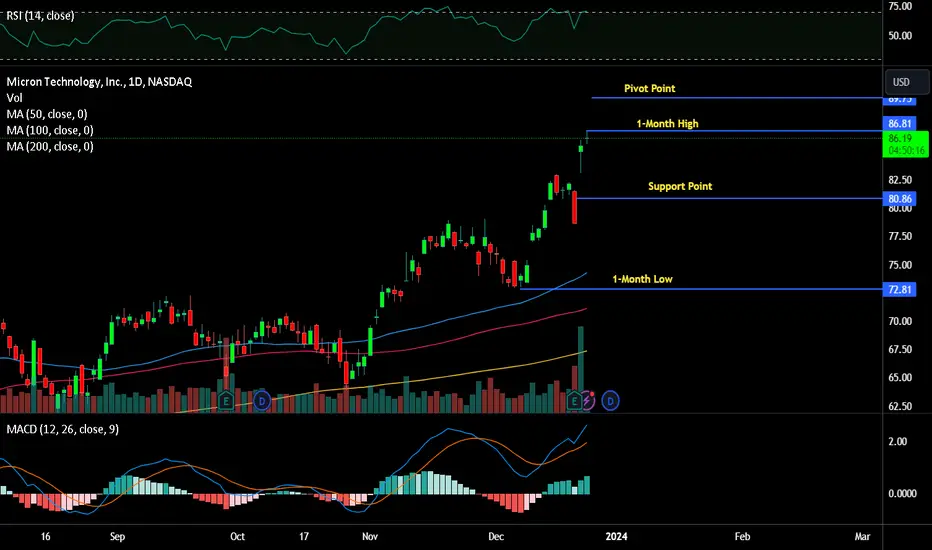
MU: Potential BuyPrice in a rising channel, expecting the bullishness to continue backed with positive analyst expectations. First target around 90 USD. Areas plotted to look out for, combined with daily and weekly moving averages to be used as S/R confluences.

MU looks bullish pre earnings I tried analyzing MU and I feel it is bullish. It is not a current market price trade as risk is way down near 73 but target is 87.
I am long and will continue to hold it as I see $88++ coming.

MU bullish trendMU with a nice triangle breakout and gorgeous trend. Buy the dip, this puppy could EASILY see mid 80's in the next 2-3 months..

Imagine support and resistance zones as floors on which...Imagine support and resistance zones as floors on which lemmings walk.
When a lemming enters a different floor, it usually walks around that floor for a while before deciding to go up or down to another floor. What would happen in your trading if you started to perceive the price as such lemmings walking between the floors of a building?

MICRON MARK UPBased on an assumption that current price action is an accumulation ,
i initiated a position today based on BO of BUEC (POE #4 ) -
Entry : 76.40
Stop Loss : 74.23
Take Profit (2r) : 80.77
Short Term Trade, more risky entry compare entry @ BUEC
Pure Wyckoff Methode

Memory and Storage Micron's share price is looking attractive at current levels but a pull-back will be appreciated. The current price still looks attractive as we come to the close of the year. The price will probably face some resistance at $ 80 if the stock pushes higher in December and January.
If the stock falls to the 50-month MA, I will buy more shares as I wait to see if the price will fall into the accumulation zone. 2024 will be another good year for the stock unless fundamental factors prove otherwise.

MU - Bullish to $85IMO, the strong earnings we just saw and sympathy could bring MU to all time highs by the end of 2023! I'm VERY bullish above $75, to AT LEAST $85ish. This ticker is a diamond in the rough and will receive sympathy from NVDA and AMD. Cheers!

Micron Technology (MU) consolidating for something big!The asset is operating within a long-term uptrend channel.
The medium-term setup appears to be an inverted H&S (Head and Shoulders) pattern. Currently, consolidation is taking place, and soon we might be witnessing a breakout, potentially aiming to retest the top of the uptrend channel.
Thank you!

MU ascending triangle!Simple analysis:
If the ascending triangle is broken, with everything being normal, the price could reach the target.

MU Going Up for A Couple of Weeks64 is an important support level for MU. This has acted as a resistance level during the peaks of Nov 2022 and Jan, Apr and May 2023. Most recently, MU had tested this level in end Sept and bounced from it.
MU is also in a symmetrical triangle formation.
A bullish harami formed on 27 October.
MU should go up to at least 72 where there is another resistance level.

Is Micron Losing its Mojo?Micron Technology has steadily climbed this year, but now there could be signs of exhaustion.
The first pattern on today’s chart is the rising trendline along the lows of December, March, August and September. Prices have pushed back toward this support, which may suggest it’s getting ready to break.
Next is the falling resistance that began in mid-September. This creates a triangle when combined with the rising trendline, which is a potential reversal pattern.
Third, MU rallied above its Tuesday high on Wednesday before rolling over. The result was a bearish outside day -- another potential reversal pattern.
Fourth, the outside candle spanned the 50- and 100-day simple moving average (SMAs). It also touched the 8- and 21-day exponential moving average (EMAs). That may suggest it’s become neutral over multiple time frames. Could a new direction begin?
TradeStation has, for decades, advanced the trading industry, providing access to stocks, options, futures and cryptocurrencies. See our Overview for more.
Important Information
TradeStation Securities, Inc., TradeStation Crypto, Inc., and TradeStation Technologies, Inc. are each wholly owned subsidiaries of TradeStation Group, Inc., all operating, and providing products and services, under the TradeStation brand and trademark. TradeStation Crypto, Inc. offers to self-directed investors and traders cryptocurrency brokerage services. It is neither licensed with the SEC or the CFTC nor is it a Member of NFA. When applying for, or purchasing, accounts, subscriptions, products, and services, it is important that you know which company you will be dealing with. Please click here for further important information explaining what this means.
This content is for informational and educational purposes only. This is not a recommendation regarding any investment or investment strategy. Any opinions expressed herein are those of the author and do not represent the views or opinions of TradeStation or any of its affiliates.
Investing involves risks. Past performance, whether actual or indicated by historical tests of strategies, is no guarantee of future performance or success. There is a possibility that you may sustain a loss equal to or greater than your entire investment regardless of which asset class you trade (equities, options, futures, or digital assets); therefore, you should not invest or risk money that you cannot afford to lose. Before trading any asset class, first read the relevant risk disclosure statements on the Important Documents page, found here: www.tradestation.com .

$MU NASDAQ:MU 1W
Ready to move up Bullish.I think it is starting of 5.Wave 1-5 completed and it is working on wave 2-5 .Wave 3-5 will start soon ...

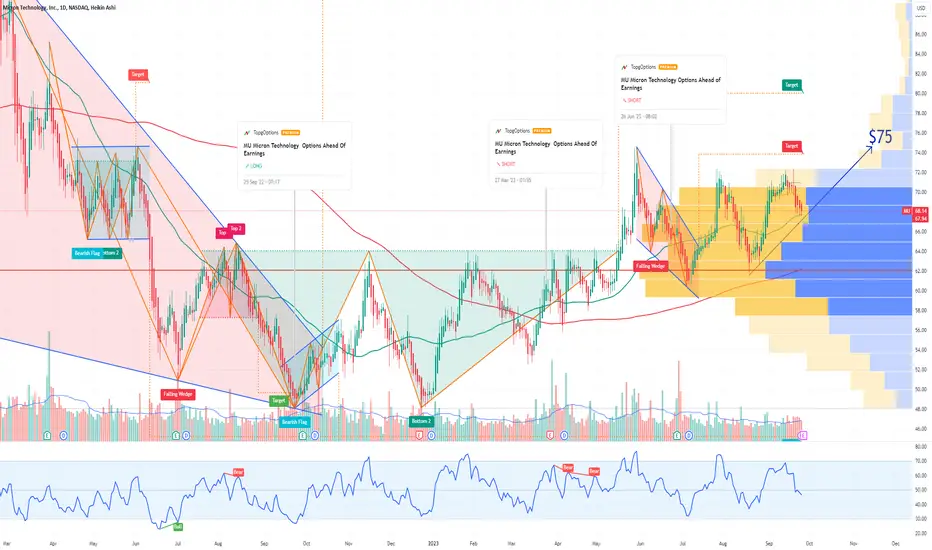
MU Micron Technology Options Ahead of EarningsIf you haven't bought MU here:
Then analyzing the options chain and the chart patterns of MU Micron Technology prior to the earnings report this week,
I would consider purchasing the 75usd strike price Calls with
an expiration date of 2024-1-19,
for a premium of approximately $3.37.
If these options prove to be profitable prior to the earnings release, I would sell at least half of them.
Looking forward to read your opinion about it.
Earnings JournalAT A GLANCE
Simplistic Analysis: swing back to the lower channel line.
Trade Type: Touch & Go don't wait for a close.
Research Depth: technical glance only.
Earnings Anticipations: positive surprises for EPS & Revenues
earnings confidence on a scale of 1-5: 2

Micron Technology Inc. ⚡I'm long in this because:
we broke the looooOOOoooonnng tren line
price > all SMAs and EMAs
if the FED doesn't raise interest rates in a few days I see the bulls lurking aroung the corner till the end of this year

Micron Tech forming a flag?MU is very interesting to me at the moment, it's currently formed a flag and as you can see in the chart we have had a steady up trend across the board in both price, RSI and MACD.
You could argue MACD has already broken out of a triangle type formation to the upside even.
The risk-to-reward ratio is quite good, you can place a trade with a stop loss just under the flag and it gives you almost a 9:1 RR. With a more liberal stop loss, you are still
looking at an R:R of almost 3:1.
The main concern here is if the tech sector start lagging in general, this could easily lag with it. Which is why I am inclined to buy the breakout and not the flag formation.
Cheers

MU Micron in a good momentum to break resistance VPA shows a huge accumulation area, ascending wedge upwards, breaking resistance at 64-65, first time to see price not immediately gapping down. I believe a good place to take a Long position for one good push before we get into some form of stagflation.

MU offers 15% - 20% ROI opportunities Micron Technology Inc. (MU) in a two-sided framework, capable of contain buying and selling pressures on a weekly basis.
If (MU) were able to close above the resistance of this framework on a weekly basis, this would elicit a buy-signal where gains of 20% would be anticipated over the following 2 - 3 months.
Inversely, if a weekly settlement below the support of this framework occurred on a weekly basis, (MU) would be susceptible to losses of 15 - 20% over the following 1 - 2 months.

Long Picks 8/30My favourite Long Ideas for today and into the future Until prixe stays above the Green TrapZone.
Picks are based on the momentum, volume and price action.
