Analysing Trends, Patterns, and IndicatorsGreetings, fellow traders! I am thrilled to present my analysis and insights on TradingView, where I will be sharing trend analysis, chart patterns, and technical indicators to help you navigate the exciting world of the stock market. It's important to note that I maintain a neutral stance and base my decisions solely on identifying promising opportunities.
As an observer of market trends, my goal is to provide you with comprehensive and visually appealing charts that showcase the potential opportunities I see. Please remember that I am not a financial advisor, and any investment decisions you make should be thoroughly researched and evaluated based on your own risk tolerance and financial goals.
In each analysis, I will walk you through the patterns and indicators I have identified, highlighting key support and resistance levels, trendlines, and other critical technical aspects. My approach is to objectively present the information and allow you to interpret it as you see fit. Whether you choose to go long or short in the stock market is entirely up to you.
My main focus is to share the knowledge and insights I have gained from studying charts and technical analysis. By doing so, I hope to contribute to your trading journey and help you become a more informed and confident trader. It is important to continuously learn and adapt to the ever-changing dynamics of the market.
I invite you to join me on this exciting journey as we explore the fascinating world of trading together. Feel free to provide feedback, ask questions, and share your own perspectives in the comments section. Your engagement and participation are greatly appreciated.
Remember, trading carries risks, and it is essential to conduct thorough due diligence before making any investment decisions. I am here to provide information, but the responsibility lies with each individual trader to make their own choices.
Thank you for taking the time to explore my charts. I hope you find value in the insights I share, and may they contribute to your trading success. Happy trading!
Disclaimer: I am not a financial advisor. The analysis and opinions expressed here are solely based on my observations and should not be considered as financial advice. Please consult with a licensed professional before making any investment decisions.
MU trade ideas

MU long positionWe expect that the price will retest the upsloping support one more time, which would be the entry for the long position.
From there we expect the price to go higher and retest the resistance which is the upper boundary of the wedge and it would be the final target for long.

Micron Pulls Back After Breaking OutSemiconductor stocks have been moving lately. Today’s chart focuses on memory-chip producer Micron Technology.
The first pattern to consider is the level around $64.30. MU peaked near this price in November, January, March and April. A breakout followed in mid-May followed by a pullback on Monday. Will buyers step in near the previous high, looking for old resistance to become new support?
Next, you have the series of higher lows over the last three months. That kind of ascending triangle may reflect increasing demand for the stock.
Third, MACD recently turned positive -- a potential sign of improving short-term momentum.
Finally, MU jumped on March 29 as analysts said its long-term demand cycle had bottomed. (The surge came despite weak earnings and revenue.) This month’s rallies in MU and the broader chip space may confirm the industry is back on the upswing. If that’s true, it could give investors another reason to target the $64.30 zone.
TradeStation has, for decades, advanced the trading industry, providing access to stocks, options, futures and cryptocurrencies. See our Overview for more.
Important Information
TradeStation Securities, Inc., TradeStation Crypto, Inc., and TradeStation Technologies, Inc. are each wholly owned subsidiaries of TradeStation Group, Inc., all operating, and providing products and services, under the TradeStation brand and trademark. TradeStation Crypto, Inc. offers to self-directed investors and traders cryptocurrency brokerage services. It is neither licensed with the SEC or the CFTC nor is it a Member of NFA. When applying for, or purchasing, accounts, subscriptions, products, and services, it is important that you know which company you will be dealing with. Please click here for further important information explaining what this means.
This content is for informational and educational purposes only. This is not a recommendation regarding any investment or investment strategy. Any opinions expressed herein are those of the author and do not represent the views or opinions of TradeStation or any of its affiliates.
Investing involves risks. Past performance, whether actual or indicated by historical tests of strategies, is no guarantee of future performance or success. There is a possibility that you may sustain a loss equal to or greater than your entire investment regardless of which asset class you trade (equities, options, futures, or digital assets); therefore, you should not invest or risk money that you cannot afford to lose. Before trading any asset class, first read the relevant risk disclosure statements on the Important Documents page, found here: www.tradestation.com .

MU Entry, Volume, Target, StopWhen price clears: 65.42
With daily volume greater than 16.2M
Target: 82.50 area
Depending on your risk tolerance: 59.73 gets you 3/1 Risk/Reward.
Resistance: 75-76 area
Nothing to show on the chart, I'm counting on a break of the long running channel on high volume.
This trade idea is not trade advice. This swing trade idea is strictly based on my ideas and technical analysis. No due diligence or fundamental analysis was performed while evaluating this trade idea. Do not take this trade based on my idea, do not follow anyone blindly, do your own analysis and due diligence. I am not a professional trader.
OverreactedI think that the price has overreacted to the morning news about trade restrictions. As the company does probably not depend on the imports in request this overreaction shall be corrected at least.

MU Long Signal 5/21/2023 @ $68.17Points of Interest
MU Long Signal 5/21/2023 @ $68.17 (or Monday 5/22/23 opening price)
Shortfall hinting at breakout direction
WRB 1st week of 2023 igniting volatility/trend confirming the rectangle pattern
Rectangle pattern appears to be a bottoming/basing formation, along with the market
Current WRB is breaking out with 2 daily closes above the resistance line confirming the breakout
$65 major level broken
Breaking all key MA’s, 20/8 rising
MACD crossing above 0, confirming upside momentum
RSI at 61, not in oversold territory and confirming underlying trend upward
Risk: 2 daily closes below $65 (or 1 weekly close)
Target is to unwind in between $80-$81

$MU bottoming patternNASDAQ:MU bottoming pattern that broke trend line. Looks very bullish. waiting for consolidation for a starter position.

TEXTBOOK HORIZONATL LEVEL BREAKEOUT ON MUMicron technology just passed through a long-standing resistance at 65. A retrace would give a good entry for a long considering the overall strength of nasdaq lately as well...

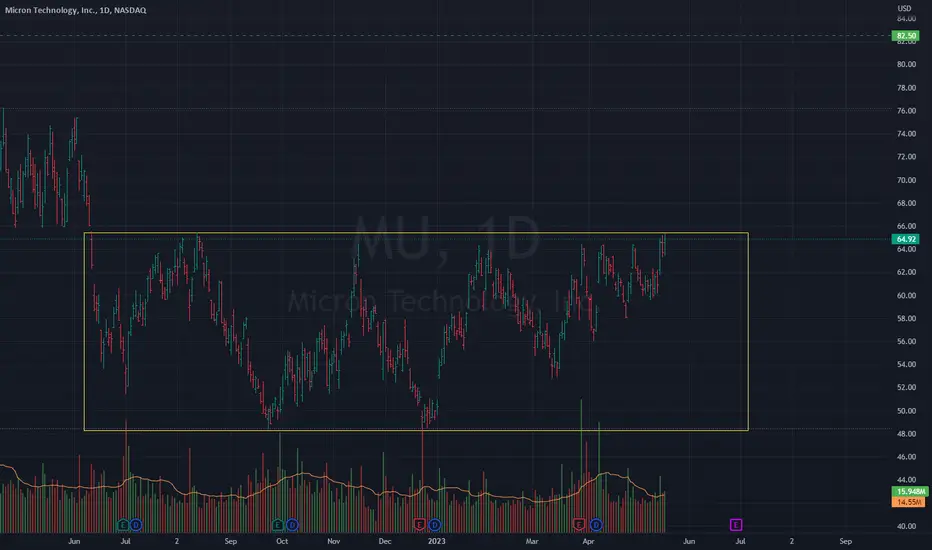
Micron Technology (MU) DCA - Rectangle Pattern Company: Micron Technology
Ticker: MU
Exchange: NASDAQ
Sector: Technology
Introduction:
Hello, and thank you for joining me for this technical analysis. Today, we will take a close look at Micron Technology (MU), specifically focusing on a Rectangle pattern that has formed on the daily chart.
Rectangle Pattern:
The Rectangle pattern is a period of consolidation, often following a significant price move, where the price bounces between horizontal support and resistance levels. This pattern can act as either a continuation or a reversal pattern, depending on the breakout direction.
Analysis:
Over the past 355 days, MU's price has been oscillating between an upper boundary at $64.37 and a lower boundary at $48.61, forming a clear Rectangle pattern. We can identify six touch points at the upper boundary and two at the lower boundary, indicating that the price is consolidating within this range.
Currently, the price appears to be attempting a breakout above the upper boundary, which could present a long entry opportunity if successful. Furthermore, the price is positioned above the 200 EMA, suggesting a bullish market environment.
If the breakout is confirmed, the price target would be $80, representing a potential gain of approximately 24%.
Conclusion:
In conclusion, Micron Technology's daily chart shows a well-defined Rectangle pattern, signaling a period of consolidation. A breakout above the upper boundary could present a lucrative trading opportunity. As always, it's crucial to manage risk effectively and ensure your trading decisions align with your overall investment strategy.
Please note that this analysis does not constitute financial advice. Always conduct your own research before making investment decisions.
If you found this analysis helpful, please like, share, and follow for more updates. Happy trading!
Best regards,
Karim Subhieh

MU - Breakout Falling Trend Channel- MU has broken through the ceiling of a falling trend channel in the medium long term.
- MU is moving within a rectangle formation between support at 59.43 and resistance at 64.83.
- MU has given a positive signal from the rectangle formation by a break up through the resistance at 63.13.
- The stock is testing resistance at 64.00.
- Overall assessed as technically neutral for the medium long term.
*EP: Enter Price, SL: Support, TP: Take Profit, CL: Cut Loss, TF: Time Frame, RST: Resistance, RTS: Resistance to be Support LT TP: Long Term Target Price
*Chart Pattern:
DT - Double Top | BEARISH | RED
DB - Double Bottom | BULLISH | GREEN
HNS - Head & Shoulder | BEARISH | RED
REC - Rectangle | BLUE
iHNS - inverse head & Shoulder | BULLISH | GREEN
Verify it first and believe later.
WavePoint ❤️

$MU Bottoming pattern weekly chartNASDAQ:MU Very nice looking bottoming pattern. Close above 65 on a weekly basis would be very bullish.

MU micron ++++++text book round bottoms closed above resistance yesterday. buy now or buy the first pull out after the break but be there kind of chart...

MU Bullish projection 5/15/23Inverse Head and Shoulders completing with a breakout forming to press past $63 CMF and MACD both support the technicals for a healthy push to $71 then $81 as next short term PT, long term this is a hold for so many reasons. Macro Geo-political environment combined with tech ever thrist to have chips available as the future continues to push automation and Micron are essentially the life blood

MU Upside breakoutFundamental:
Semi-conductors are the backbone of web 3.
Technical:
MU has been in a trading range for almost 2 years.
Q2 had a failure swing on the weekly chart, is this an indication of the breakout direction?
$66 is the key level

$MU: Monster signal in MicronI'm long NASDAQ:MU here, I like the low probability 3rd target range as a possibility here, but that is a long shot. NASDAQ:INTC and NYSE:TSM are also starting to base, and could rally back to the top of the recent range and maybe break out into a new monthly trend over time soon...
Generally speaking, T@M signals have a win rate between 55% and 65%, but in cases like this where a stock is hitting the same range repeatedly and then clearing sellers out and breaking out, you can expect signals to reach the 2nd or 3rd target range by the time the forecasted time elapses or sooner in a substantial amount of trade samples.
Stop loss area should be a bit below the weekly mode zone @ $59.90, so consider that for sizing criteria.
Best of luck!
Cheers,
Ivan Labrie.

MU ascending triangleOn the chart we can see an ascending triangle which is a bullish pattern. Therefore we can expecting the break out to the up side.
How to trade:
trade a break out with the volume increase in order to avoid trading false break out.
Target is shown on the chart.

MU - try to find entry pointNASDAQ:MU - 12 year chart.
1.Below AVWAP from the low of 2016 is not taken.
2. 10 month consolidation in $$ 49-65 range
3. Price is back in a multi-year rising channel and is trading not too far from its lower boundary
4. Is near the upper boundary of the descending channel with a high in January 22
5. Trades near the AVWAP from the highs of 2022
6. RS on the weekly charts is moving into positive territory.
7. Well all memory manufacturers have announced price increases.
In case of consolidation above $68 we can look for an entry point into the stock. I do not exclude a pullback into the 60-62 range after AVWAP breakdown.
Stop calculation (mandatory) will need to be done depending on entry point and position size.
This is not an investment idea

MU still rounding out nicelyMU is still rounding out nicely. Nice bounce off the daily 200. Might be worth a small starter and watch for a break of 65.

$MU rejection zoneNASDAQ:MU continues to reject the line, hasn't made a move similar to AMD or NVDA.
This one is seriously lagging.

RectangleHorizontal trading range.
There is an ABC/D pattern within the rectangle.
Price is at resistance of the rectangle.
No recommendation

$MU stabilizing at $62I see Micron settling in at around $62/share.
I am curious how it is benefiting from the continuing pressure around Taiwan and that impact on $TSMC.

$MU consolidaton66 big level hit 5 times
consolidation after huge gap down
huge uptrend potential and maybe new higher highs
swing calls
1 to 2 months out

MU Micron Technology Options Ahead Of EarningsIf you haven`t bought MU on my last signal:
Then you should know that looking at the MU Micron Technology options chain ahead of earnings , I would buy the $60 strike price Puts with
2023-5-19 expiration date for about
$3.60 premium.
If the options turn out to be profitable Before the earnings release, I would sell at least 50%.
Looking forward to read your opinion about it.
