MU trade ideas

mu alternate viewMu, alternate view.
I would keep an eye on this all through the week.
had similar setup on amd on oct 25th 2021, and took a sell only to lose money.
so this alternate view wrt my previous view on sell.


Micron cerca de romper record del 2000. Lo lograra? Micron sigue subiendo después de su reporte trimestral, y al los analistas arrancar el 2022 subiendo sus estimados con respecto a la accion. Les contamos como la salud técnica y fundamental están en la accion de cara hasta 2022

Short MUMy biggest short opportunity for those out there watching my posts is MICRON. MU has not only hot the top of its fib retracement, but also double topped. I'm short this stock until $77.
Not financial advice

Closed: MU January 21st 86/97.5 Short Strangle... for a 2.12 debit.
Comments: Total credits collected of 3.23 (See Post Below). Closing it today for 2.12 results in a realized gain of 1.11 ($111), which was my original profit target.

$MU LevelsBreak out zones:
$96.37
$95.9
Bull PT:
$97.78
$99.05
$100.13
Bear PT:
$94.83
$93.71
$92.36
$90.88

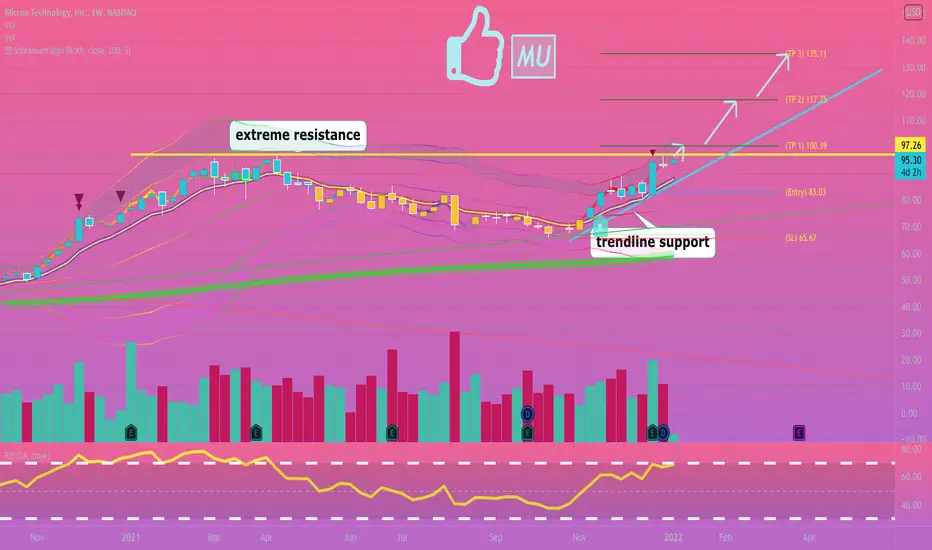
potential all time high breakout here🦉MU looks like it will do a parabolic breakout past all time highs any day now, rsi is near overbought range so be careful.
price targets if it breaks 97: 100.39-117.75-135.11
like and follow for more 💘
$mu analysis 30minAfter wicking into all time high supply, a head and shoulders patterned has formed suggesting a move to the downside. $92 is the key level here. This is a price you can play long and short off of. The directional movement of $MU will depend on the overall strength of other semiconductor names, this could easily make new highs in the following weeks of January.

$mu analysis Sometimes there is no need to get creative. Semiconductors have been hot, and $MU is one of the few that hasn't made a new high yet (although it came close, wicking into supply levels near the all time high of $96.69). The bigger picture here is that price is extended from the 21 day and closed below the 5 day last week. It seems a slight pullback is in order

MU BreakoutIf MU can breakout here we can see a move up to $96. If it can't breakout and can't hold supports there's a pretty big gap to be filled to the downside.

Mu looking for resistancewatching to see if we break higher or fall off this resistance. lost of selling pressure in this zone.
Be real careful this has made rsi 80 before and if it does again blow a short position up

MU double topAfter reanalyzing MU's chart, it can be seen that MU has reached the 4.236 fib retracement as well as formed a double top. There are several gaps to fill going down as far as $58. I believe we fill the $58 gap in 2022, but for now the focus is on gaps at $83 and $77.

LONG MUExpect a big and final move to 103 from MU, before considering shorting. MU is currently fighting resistance at 97, but I expect a breakout to MU's final resting place at $100-105
Not financial advice
Happy Trading

$MU - Retesting ATHsAfter a stellar earnings report, $MU is retesting former ATHs set nearly TWENTY years ago.
A break above sends us MUCH higher, especially with semis set to gain ground in 2022!

Rolling: MU January 21st 69 Short Put to 86... for a 1.01 credit.
Comments: With the 69 short put converging on worthless, rolled it up to a strike with a delta about half that of the short call. I originally collected 2.22 in credit for the 69/97.5 short strangle (See Post Below) and had a profit target of 50% of that or 1.11. Consequently, I'm revising the profit target to 1.11 plus what I received for the roll up of the 69 (1.01) (i.e., my new profit target to take off the now 86/97.5 is 2.12).
The other way to look at it is that I've collected a total of 3.23 in credits -- 2.22 for the original setup plus 1.01 for the roll up, and I want to close it out for 1.11 less than that or 3.23 - 1.11 = 2.12.

MU: A Put Buyers Dream SetupIn a perfect world this rejects 94.42 and we can short this thing back to $87.43. This is a perfect setup for a short to then create a "handle" of a "cup & handle" formation for chartists.

$MU | Watchlist #1 | 12/27 - 12/31 MU 94 BOUNCE
or 92.7-93 BOUNCE
Strategy:
Post earnings report rally
Buy into weakness at the bounce levels
News Catalyst: "Micron Technology (MU) shares were up nearly 5% to trade at $94.84 on Thursday, as more than 25 million shares changed hands shortly before 2:30 p.m. EST. Over the past five trading sessions, Micron has risen more than 16%, compared to a 1.7% gain for the S&P 500." - seekingalpha.com

Bullish moveBreak out and Gap up on open with High volume
Stops 5-7%
Target 20%
Not financial advice please use proper risk management

Is Micron ready for new ATH’s?$MU Liking this a lot especially if we do get our Santa rally after all.
Just had earnings and smashed through weekly supply. Had a nice gap and go play today already testing the bottom of supply at these ATH levels.
If tomorrow we see a pullback I wanna BTD at:
BTD 1 Top of supply if $ 90 holds
Or
BTD 2 / SL: 88.80 yesterdays low
Below 88.50 I’m not interested.

MU post earningsHas been trading in a range (possible Bull flag ) Since breaking out of a massive cup and handle that you Can see on the monthly. In the Aftermarket MU closed right at the top of this range. Any breakout over 88$ and MU could be headed for new ATH. A rejection here and were headed back to 80$ range bottom.
Long entry - Over 88.50
Target - ATH
Stop loss 87$
Short entry - 86$
Stop loss - 88$
Target - 80$

Short fundamental and technical analysis of a 'must have' stockQuarterly report:
Very impressive in my opinion. It was beating analyst estimations both in terms of revenue and earnings as well as future guidance and outlook. Investors are happy and on pre-market the stock is gaining more than 8% at the time of writing.
Fundamental analysis:
1. Valuation:
I could say that historically $MU had better valuation than it currently has, however if compared to industry peers and the overall market the valuation seems OK to me... especially in current highly overvalued environment and FED hawkish tone.
2. Growth:
The company remains a growth story. Earnings are forecasted to grow roughly 20% per year in the near future. Revenue growth is estimated to be not so significant.
3. Profitability
Luckily the company is extremely profitable. It was reported that gross margin equals 46.4%, operating margin equals 34.2%, while net income margin is almost 30%.
4. Financial position:
Excellent. Cash rich, almost no debts and well covered.
5. ESG rating:
Low risk and good rating (17.7 at Sustainalytics)
6. Dividend $ Buyback:
0.49% the current div yield and TTM the company repurchased $1.3b of its common stock.
Technical analysis:
The company is gaining on pre-market and remains in the uptrend. Next psychological resistance is around 100. This is the price where I will slightly rebalance my position.
Thanks for reading,
Feel free to ask any questions or comment down below.

$MU bullish reversal$MU Micron Technology Fiscal Q1 Results Rise; Issues Fiscal Q2 Guidance -- Stock Gains 6% After-Hours
stock just breakthrough the first resistance at 84.30 with the stock gapping up at after hour, people might take
some profits at the opening bell tomorrow. maybe wait for a bit to settle down until premium gets a bit cheaper
and see the formation of the stock is going.
also $MU is about to enter a squeeze and buyers in control so this could
possibly continue to push up and break ATH.
day trading entry scalp
BUY call above 86.90 sell at 88.90+
BUY puts below 83.96 sell at 80.95
always take profits as you see one. always follow your plan and risk management.
Hello everyone,
welcome to this free technical analysis . ( mostly momentum play )
I am going to explain where I think this stock is going to go over the next day or week play and where I would look for trading opportunities.
If you have any questions or suggestions which stock I should analyze, please leave a comment below.
If you enjoyed this analysis, I would definitely appreciate it, if you smash that LIKE button and maybe consider following my channel.
Thank you for stopping by and stay tune for more.
My technical analysis is not to be regarded as investment advice. but for general informational proposes only.
