Microvision Inc (MVIS).Stock on triggering Explosive Level.
🦈 Shark Harmonic shap Target price above 14$ .
Any breaking up Resistance level 1.21$ , Buying signal triggering, Explosive level = 1.95$
Highly recommended for Buying now 👌
MVIS trade ideas

Markets Converging MVIS market changing potentialMicrovision is weeks away from hitting an intense inflection point.
Pending news for SBMC (decision date August 29th )
Microvision is partnered with NVDA for their driving lidar and software -- and have a plug and play system better than any competitor. (an update was made to MVIS website while not yet on the NVDA website. Possibly indicating pending news related)
Industrial contracts are positioned to come in by September of this year.
Potentially in the month of August/September MVIS could announce news of wins in 3 different verticals absolutely flipping the bear base upside down. causing an insane short squeeze. (to TRUE/FAIR market evaluations)
The 5 year chart I have shown indicate moves and price targets as well as time frames for news. The consolidating 5 year wedge can also be seen as wyckoff accumulation. There are multiple indicators implying bullish divergences on the 5 year time frame. People WANT MVIS.
These markets MVIS are entering are HUGE and going to grow astronomically. The potential upside if MVIS is established as the key player could be INSANE.
Lidar competitors have typically 1 vertical. Microvision has 5.
I believe the catalyst to all of this is news related to SBMC. industrial and automotive OEMs are conservative and want a company that will survive to fulfill their needs. an SBMC would guarantee survivability and military approval.
I believe multiple OEMs are waiting for this exact moment. if MVIS is selected by the DoD, then a domino effect will happen in all 3 markets.
META, GOOGLE, APPL will also then see the AR tech validated & may proceed with trying to buy them out or purchase licenses.
This stock, could be THE stock of a lifetime.
MVIS Swing Trade Setup & Technical AnalysisCurrent Price Action:
• MVIS is trading at a key support zone ($1.30-$1.40), which has historically been an accumulation area.
• The broader trend remains bullish, but short-term price action is consolidating.
• Volume is increasing, indicating growing interest, but a decisive breakout or rejection from this level will determine the next move.
Potential Scenarios:
• Bullish Case: If a bounce is confirmed, the first resistance to test is $1.80-$2.00, with potential continuation toward $2.50 and beyond.
• Bearish Case: If support breaks, the next downside targets are $1.00 and possibly lower.
Trade Plan: Stop-Loss & Take-Profit Levels
• Entry Zone: $1.30 - $1.40
• Stop-Loss: Below $1.20 (or tighter at $1.25 to limit risk)
• First Take-Profit (TP1): $1.80 - $2.00 (key resistance zone)
• Second Take-Profit (TP2): $2.50 (strong resistance area)
• Trailing Stop: If the price reaches 20% profit, set a trailing stop to protect gains.
Upcoming Catalyst:
• Earnings in 9 days – Could drive volatility and momentum.
• Analyst Price Target: Average estimate of $2.50, indicating potential upside.
________________________________________
Key Partnerships & Clients
• Stellantis – Confirmed partnership to integrate MVIS LIDAR into next-generation vehicle safety and automation.
• Ibeo Acquisition – Strengthened MVIS’s LIDAR portfolio by acquiring key assets from Ibeo Automotive Systems.
• NDA Clients – MVIS has disclosed working with multiple OEMs in the automotive sector, though specific names remain confidential.
• Defense & Industrial Interest – Their sensors are being evaluated for military and industrial applications.
Why It Matters
• MVIS LIDAR aligns with the growing push for AI-driven automation and autonomous vehicles.
• The Stellantis partnership validates real-world adoption of their technology.
• As AI and automation expand, high-resolution LIDAR demand is expected to rise.

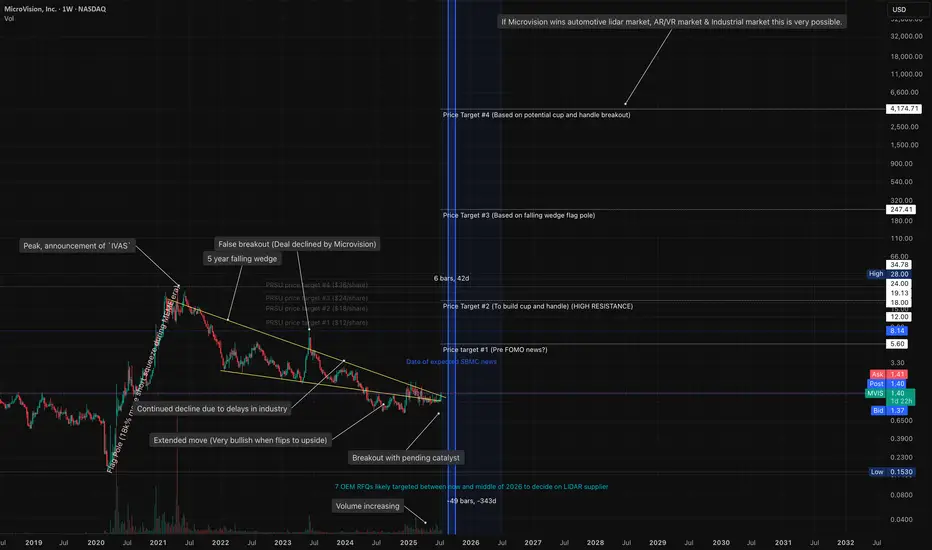
MVIS multi pattern bullish reversal to 5 year highs and beyondgiven the different chart patterns.This is my humble expectation for MVIS between now and end of 2026.I believe we will FOMO to $3.00 before news. Settle back down to 1.50 range forming an inverse head and shoulders.Then with good news, running to $7/8 range and consolidating. At that point, we will be in squeeze territory. A breakout from there sending us to mid 20s where we will find resistance from 2020/2021. profits will be taken but That is when revenues start really ramping up and contracts start getting solidified for automotive. After the resistance is found the 5 year cup and handle will have formed. The next push will be beyond that 2020 resistance area to $50 ish. I think we will come back down to re-test the cup and handle and then push harder as more news is announced. running to $200+. Likely going back to the $550 ATHs if MVIS can achieve what they've set out to do and be the utmost winner of Industrial, Automotive, and AR technology. YOU are at ground 0.

Microvision is entering new price levels.NASDAQ:MVIS has broken the $2.00 resistance, forming a new trading range from that level. This stock is ideal for long-term investments as well.
(This is our signal)

MVIS ready to go? Technical Analysis of MVIS (MicroVision, Inc.)
Key Observations:
Falling Wedge Pattern:
The chart shows MVIS trading within a long-term falling wedge, which is generally a bullish reversal pattern if broken to the upside.
The stock attempted to break out recently but is currently testing key levels.
Resistance Turned Support (~$1.35 - $1.40):
The yellow highlighted area represents a previous resistance zone that has now turned into support.
MVIS has tested this level multiple times, which strengthens its importance.
Short-Term Price Action:
The recent breakout above the descending resistance line failed to hold, leading to a retest of the support zone.
Holding this level could confirm a higher low, indicating potential accumulation before another breakout attempt.
EMA Clouds:
The stock is currently trading near key moving averages, with some rejection at the upper EMA bands.
A clean move above these EMAs could trigger further upside.
Breakout Confirmation Levels:
Bullish Case: If MVIS holds the $1.35 - $1.40 support, a retest of $1.60 and beyond is likely.
Bearish Case: Losing this support could send MVIS back into the wedge and test lower trendline support.
Conclusion & Trade Setup:
If support holds, this could be an early trend reversal signal within the wedge.
A confirmed breakout above the upper trendline could push the stock toward $1.75 - $2.00 resistance levels.
However, if the support at $1.35 fails, downside risk increases toward $1.10 - $1.00 levels.

$MVISOff lows, break out of descending wedge with a low volume retest. Key area to break low 1.70s for move into mid SET:2S with short term targets green, white, and pink lines in that area.

#MVISPrice looks promising after a very long W2 correction structure. Impulse buying of the lows are very visible on smaller TF

$MVIS call Jan 7th, 2025Symmetrical Triangle Formation:
The price is forming a symmetrical triangle, which often indicates a potential breakout. This is a period of consolidation, and breakouts can provide strong momentum if volume accompanies it.
Risk-to-Reward Ratio:
Based on the chart, the potential upside (green zone) is significantly larger than the downside (red zone). This provides a favorable risk-to-reward ratio (~3:1).
Support Levels Holding:
The price appears to be bouncing off a trendline supported by the 200-period moving average (green line), which is often considered a strong long-term support.
Higher Lows:
There are signs of higher lows forming, suggesting bullish pressure and accumulation by buyers.
Bullish Targets:
If the stock breaks above the upper triangle boundary, the price could rally up to $1.70–$1.80, offering a 20%+ upside.

Monday MVIS Trade Setup!🔻 **Stop Loss (SL):** Below **1.39**
📈 **Entry:** Above **1.51**
🎯 **Target 1 (T1):** **1.61**
🎯 **Target 2 (T2):** **1.75**
💡 **Why Trade:**
Symmetrical triangle breakout with bullish momentum and strong volume support.
✅ **Conclusion:**
Prepare for Monday’s breakout opportunity; monitor volume and momentum for confirmation. 💪📊

Why Does the $MVIS Chart Look Ready to Break Out?NASDAQ:MVIS , with its advanced technology in autonomous driving, appears to be a good long-term investment. A breakout seems likely in the near future.

MVIS Longdaily, Support line
Long 0.83
no Stop
Target 1.85, 2.7
Risk management is much more important than a good entry point.
I am not a PRO trader.
In my trading plan, the Max Risk of each short term trade should be less than 1% of an account.


MVIS continuing to range $3strong growth in revenue YOY
Potential H & S on daily will pick up at 1$ or under

MVIS compared to the Lidar competitors by market cap.In this photo you can see that MVIS has increased in market share of the Lidar market. Now sitting at 14%. Seemingly skyrocketing. This is mostly due to the competitors decreasing in value. Which increased MVIS’ steak in the game. It will be interesting to see how this plays out for a possible breakout seems to be taking place.

MVIS small-er term Gann (4 years)In this Gann chart you can again see MVIS respecting the curved lines and middle trend line. $28 was further way from the middle trend line than .82 a few days ago. were still not as 'dramatically' away from the rend as we were at 28, but I do think with a break of this curved line that MVIS is currently in, could be explosive.

MVIS Gann Chart ALL Pt 2IN this Gann chart of MVIS you can see another way that MVIS is respecting the curved lines. at 550 down to .15 MVIS followed the green channel (relatively) and then the channel ended and it broke out. Currently sitting in the outer blue channel where there is uncharted territories.

MVIS All time GANN chartIn this chart you can see that MVIS has generally respected the curved lines and middle downtrend line (45 degree) angle. Bouncing off of them and on break throughs dropping to the next level. The last time we dropped to .15 MVIS bounced off of the curved green line all the way back up to the next one (and back down). At .82 MVIS was sitting on that curved line again. Thus far has bounce a small percent off of it. Looking for a continuation / repetition here.

Falling Wedge Breakout Below Lower Trend Line MicroVision: MVISBreakouts below the lower trend line are atypical but do sometimes occur. These usually occur in a pre-existing downtrend that is coming to an end. The move is usually accompanied by fairly high momentum, as if squeezing out the very last bit of bearish strength. A characteristic feature is the strength of the breakout, which can be very significant in a very short time, recognizable by the sudden rather large distance between the price and the SMA20, for example. Going short based on this downward price breakout is highly speculative because the probability of an at least equally sharp incline is quite significant.
NASDAQ:MVIS

MVIS - Signs of a possible bullish reversalSplit Screens.
Right chart: Monthly Fibonacci Retracement.
MVIS has retraced down to a local low of $1.15, and bounced off the 0.618 golden pocket.
Will the 0.618 hold as support? The month hasn't ended yet, so we will need to wait and see.
In the big picture it looks like this could be the end of wave 2 of the Elliot Wave.
In Elliot Wave Theory, wave 2 is a pullback to the 0.5 - 0.618 of the Fibonacci, which MVIS has done so far.
If my guess is correct and this is the end of wave 2, then wave 3 would be next.
Wave 3 of Elliot Wave is a parabolic rise up. It's never the shortest wave and is usually the longest.
Left chart: Weekly Gravestone Doji candle formation.
There's one more day left in the week so this candle hasn't confirmed yet.
It presently is forming a gravestone doji candle. It could possibly even close as an inverted hammer by the end of Friday.
Both formations are sometimes signs of a bullish reversal.
A gravestone doji is a bearish signal at the TOP of rallies. But forming this candle in a downtrend, as is the case for MVIS, could mark a bullish reversal.
Looking at the Stochastic Rsi, momentum is currently below the 20 level, signaling a reversal could be coming soon. (green circle)
Looking at April 2023, the Stochastic Rsi dipped under the 20 level and quickly broke back above. (orange circle) This resulted in a +300% gain in 42 days.
Also a dragonfly doji formed at the bottom of the downtrend, signaling a bullish reversal.
In the next few weeks we will see how MVIS plays out, and we will know for certain if my thesis is valid.

Decent Bounce Off Weekly TrendPosted recently that monthly chart is at a key RSI divergence point. Was neutral during that post, waiting to see what happened in shorter time frames.
This past week, we tested and bounced decently off a weekly price trend. Taking a closer look, the bounce paused due to a key price trend on the daily chart. Assuming we see continuation on Monday (closing over $1.51), that would appear to be setting up bullish divergence on daily, weekly, and monthly.
Personally took positions by writing short term calls and took on a few deep ITM leap calls.

MVIS Monthly RSI Bounce?Watching MVIS monthly chart closely this and next month. Is third time the charm? The first two bounces off RSI trend all gave at least 4x. If we fall through all bets are off.

MVIS targetAfter a highly successful prediction in 2021 for this stock (), per request, here is an update for it's near future with an updated chart.
