Niagen Breaks Out: Eyes on $15–17 as Momentum TargetsNiagen Bioscience ( NASDAQ:NAGE ) is in vertical price discovery mode, pushing into new highs with strong trend momentum, but with RSI at 78.66 and a flattening MACD histogram, it’s nearing a classic short-term exhaustion zone
Technical Breakdown
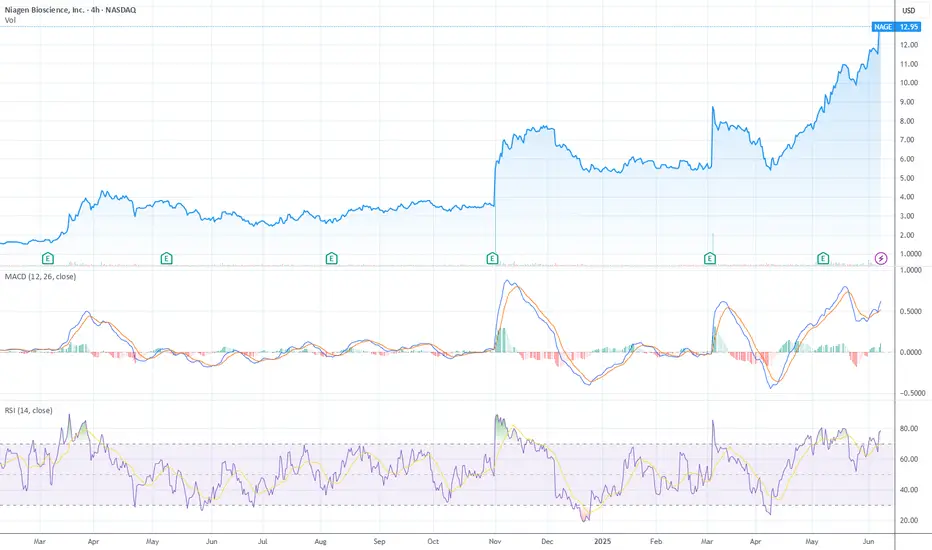
1. Price Action – Parabolic Advance
Price is climbing in a near-vertical channel from the $5–6 range in March to now $12.95 — a 2x+ move in just a few months. No clear resistance above = price discovery, but these steep climbs often invite sharp mean reversion when momentum fades. No signs of topping yet, but late buyers risk being exit liquidity if volume dries up.
2. RSI – Deep Overbought
RSI is at 78.66, right near the extreme threshold (>80) where pullbacks are common. Note the last RSI spike above 80 in April led to a sharp correction. If RSI rolls while price makes new highs, that’s bearish divergence risk — an early signal of topping.
3. MACD – Still Positive, But Slowing
MACD lines are bullishly stacked, but the histogram is flattening — a signal that momentum is stalling. A bearish MACD crossover here would confirm that this rally leg is losing energy.
4. Volume – Watch Closely
Volume data is light on this chart, but recent candles don’t show a volume climax — suggesting this may not be euphoric yet, but it’s close. One high-volume reversal candle near the top could flip sentiment fast.
Fibonacci Extension Setup
We'll anchor the extension to the March 2025 low and the recent pre-breakout high, using the most relevant and aggressive up-leg:
Swing low: ~$5.00 (March 2025)
Swing high: ~$11.50 (May 2025)
Pullback low: ~$9.00 (early May dip before this new breakout)
Extension Targets
1.0x $11.50 Already cleared (prior high)
1.272 $13.25–13.50 Short-term upside target, within reach
1.618 $15.00–15.25 Primary extension / high-conviction zone
2.0 $17.00 Stretch target in euphoric continuation
These levels line up well with psychological round numbers and the measured strength of the rally.
What Would Validate These Targets?
RSI stays above 65–70 (healthy overbought, not divergent)
MACD avoids bearish crossover and histogram turns back up
Breakout continuation above $13.25 with volume
What Would Invalidate?
Sharp rejection from $13.25 or $14 with divergence
RSI dropping below 65 while price stalls
Bearish MACD crossover + red candle volume spike