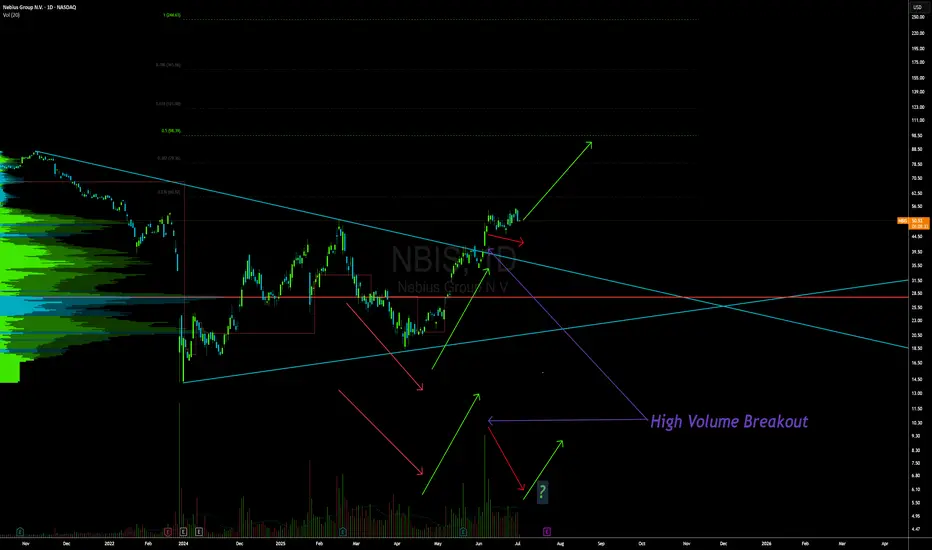
NBIS 55 BREAKOUT in the works!NBIS is an AI darling and a big momentum stock. When it goes it goes! it has been testing this 55 level for some time now.
We recently had a big GS upgrade that "woke" it up. A rest day here and another one will let the 9ema catch up to it and allow for a big breakout. If we take out this trendl
Next report date
—
Report period
—
EPS estimate
—
Revenue estimate
—
−1.03 USD
143.20 M USD
117.50 M USD
188.99 M
About Nebius Group N.V.
Sector
Industry
CEO
Arkady Volozh
Website
Headquarters
Amsterdam
Founded
2004
ISIN
NL0009805522
FIGI
BBG001NVJ6W4
Nebius Group NV is a technology company that provides infrastructure and services to AI builders worldwide. It offers Nebius AI, an AI-centric cloud platform provides full-stack infrastructure, including large-scale GPU clusters, cloud services, and developer tools. The company also operates through specialized brands: Toloka AI, which partners in data for generative AI development; TripleTen, an edtech platform focused on re-skilling individuals for tech careers; and Avride, which develops autonomous driving technology. Nebius Group was founded by Elena Kolmanovskaya, Ilya Segalovich, Mikhail Fadeev, and Arkady Volozh in 1989 and is headquartered in Amsterdam, the Netherlands.
Related stocks

NBIS Bullish Technicals.
NBIS Fundamentals.
1. Massive Growth – The stock’s up a jaw-dropping 138% in just 3 months!
2. YTD Beast Mode – Up 81.6% so far in 2025.
3. Momentum Heating Up – Gained 36.9% over the last month alone.
4. Super Low Debt – Debt-to-equity at just 0.06 — strong balance sheet!
5. Si
NBIS - bullish cross on 50 and 200MAThe golden cross hasn't happened yet but is about to happen. Keep this in your radar.

NBIS Swing Trade Plan – 2025-06-09🧾 NBIS Swing Trade Plan – 2025-06-09
Bias: Moderately to Strongly Bullish
Timeframe: 3–4 weeks
Catalysts: AI sector strength + institutional buying + momentum breakout
Trade Type: Long equity (shares)
🧠 Model Summary Table
Model Direction Entry Price Stop-Loss Target Price Risk Size Confidence
DS L

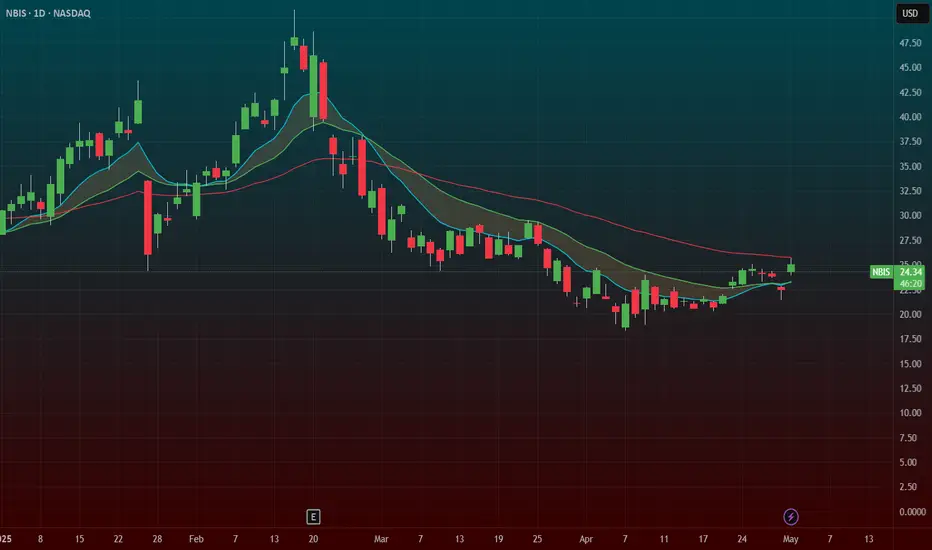
NBIS should correctNBIS has pumped yet again into the weekly supply zone. Advanced stochastic is on the high end, and there is a huge gap in the middle of the range. It would be realistic to see 32$ again given how volatile this stock is. BBWP has remained elevated for months.

NBIS : Long worth TryingNebius group stocks are technically strong.
The downtrend since November 9, 2021 has been broken and the price is trading above the 50 and 200-period moving averages.
When we draw a medium-term Fibonacci level, we can take the take profit point at 0.618 and the stop-loss point at 0.382.
This give

Nebius (NBIS) Powers AI Workloads With GPU Dev ToolsNebius Group N.V. (NBIS) builds full-stack AI infrastructure using GPU-accelerated cloud platforms, data-center hardware, and developer tools. The Amsterdam-based company—spun out from Yandex—supports AI workloads through Nebius.AI, Toloka AI, Avride, and more. With strong investor backing including

Long NBIS as it completed Intermediate waves I and III believe that now NBIS is in wave III.
Wave II retraced almost all the wave I.
I will try to update on smaller waves as they progresses.

NBIS watch $23 below, $24.5 above: Double Fibs defining key zoneNBIS recovering quite well but currently retracing.
Watching double fibs below for support at %23.01-23.03
If we bounce then target will be double at $24.57-24.59

Base Breakout Setup NBISwith the market picking up steam this NBIS is ripe for a base breakout setup. this 25 zone is huge. if we can break through it and reclaim the 50sma and the general market can stay strong we could have a runner here.
with META and MSFT having positive reactions to the earnings the tech market is
See all ideas
Summarizing what the indicators are suggesting.
Neutral
SellBuy
Strong sellStrong buy
Strong sellSellNeutralBuyStrong buy
Neutral
SellBuy
Strong sellStrong buy
Strong sellSellNeutralBuyStrong buy
Neutral
SellBuy
Strong sellStrong buy
Strong sellSellNeutralBuyStrong buy
An aggregate view of professional's ratings.
Neutral
SellBuy
Strong sellStrong buy
Strong sellSellNeutralBuyStrong buy
Neutral
SellBuy
Strong sellStrong buy
Strong sellSellNeutralBuyStrong buy
Neutral
SellBuy
Strong sellStrong buy
Strong sellSellNeutralBuyStrong buy
Displays a symbol's price movements over previous years to identify recurring trends.
Frequently Asked Questions
The current price of NBIS is 54.43 USD — it has increased by 1.77% in the past 24 hours. Watch Nebius Group N.V. stock price performance more closely on the chart.
Depending on the exchange, the stock ticker may vary. For instance, on NASDAQ exchange Nebius Group N.V. stocks are traded under the ticker NBIS.
NBIS stock has risen by 0.18% compared to the previous week, the month change is a −3.84% fall, over the last year Nebius Group N.V. has showed a 127.36% increase.
We've gathered analysts' opinions on Nebius Group N.V. future price: according to them, NBIS price has a max estimate of 84.00 USD and a min estimate of 47.00 USD. Watch NBIS chart and read a more detailed Nebius Group N.V. stock forecast: see what analysts think of Nebius Group N.V. and suggest that you do with its stocks.
NBIS reached its all-time high on Nov 8, 2021 with the price of 87.11 USD, and its all-time low was 9.94 USD and was reached on Aug 24, 2015. View more price dynamics on NBIS chart.
See other stocks reaching their highest and lowest prices.
See other stocks reaching their highest and lowest prices.
NBIS stock is 11.04% volatile and has beta coefficient of 2.08. Track Nebius Group N.V. stock price on the chart and check out the list of the most volatile stocks — is Nebius Group N.V. there?
Today Nebius Group N.V. has the market capitalization of 12.22 B, it has increased by 14.82% over the last week.
Yes, you can track Nebius Group N.V. financials in yearly and quarterly reports right on TradingView.
Nebius Group N.V. is going to release the next earnings report on Aug 7, 2025. Keep track of upcoming events with our Earnings Calendar.
NBIS earnings for the last quarter are −0.48 USD per share, whereas the estimation was −0.45 USD resulting in a −7.87% surprise. The estimated earnings for the next quarter are −0.47 USD per share. See more details about Nebius Group N.V. earnings.
Nebius Group N.V. revenue for the last quarter amounts to 55.30 M USD, despite the estimated figure of 57.73 M USD. In the next quarter, revenue is expected to reach 101.20 M USD.
NBIS net income for the last quarter is −113.60 M USD, while the quarter before that showed −136.60 M USD of net income which accounts for 16.84% change. Track more Nebius Group N.V. financial stats to get the full picture.
No, NBIS doesn't pay any dividends to its shareholders. But don't worry, we've prepared a list of high-dividend stocks for you.
As of Jul 31, 2025, the company has 1.37 K employees. See our rating of the largest employees — is Nebius Group N.V. on this list?
EBITDA measures a company's operating performance, its growth signifies an improvement in the efficiency of a company. Nebius Group N.V. EBITDA is −369.70 M USD, and current EBITDA margin is −301.62%. See more stats in Nebius Group N.V. financial statements.
Like other stocks, NBIS shares are traded on stock exchanges, e.g. Nasdaq, Nyse, Euronext, and the easiest way to buy them is through an online stock broker. To do this, you need to open an account and follow a broker's procedures, then start trading. You can trade Nebius Group N.V. stock right from TradingView charts — choose your broker and connect to your account.
Investing in stocks requires a comprehensive research: you should carefully study all the available data, e.g. company's financials, related news, and its technical analysis. So Nebius Group N.V. technincal analysis shows the strong buy rating today, and its 1 week rating is strong buy. Since market conditions are prone to changes, it's worth looking a bit further into the future — according to the 1 month rating Nebius Group N.V. stock shows the strong buy signal. See more of Nebius Group N.V. technicals for a more comprehensive analysis.
If you're still not sure, try looking for inspiration in our curated watchlists.
If you're still not sure, try looking for inspiration in our curated watchlists.