Nebius Group N.V. (NASDAQ: NB)⚠️ Disclaimer: This chart is for educational purposes only.
Cup and Handle Pattern Formation
Cup Formation:
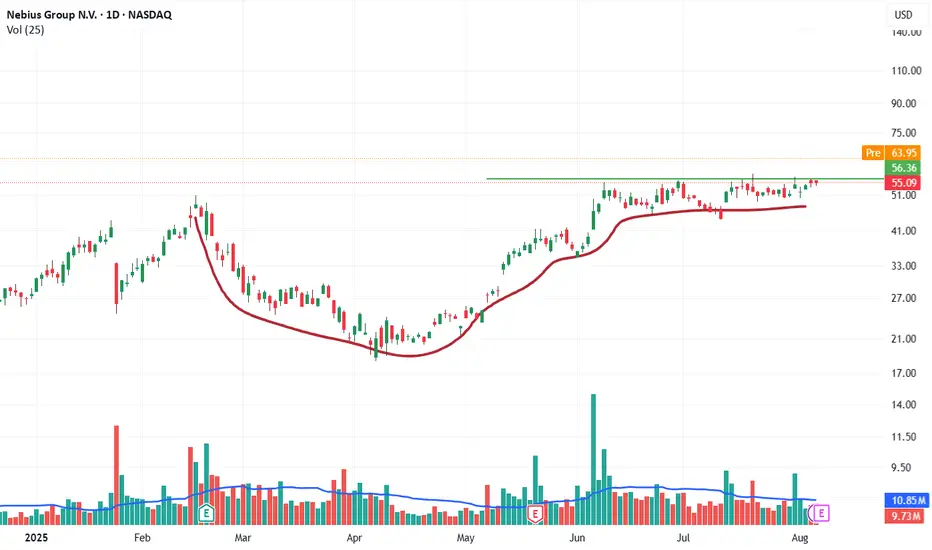
The price peaked near $63–$64 in February 2025, followed by a rounded bottom forming a "cup"-like structure between March and May 2025.
This rounded shape is smooth and symmetric, matching the textbook "cup" base.
Handle Formation:
From June to August 2025, price entered a shallow consolidation phase just below the $63–$64 resistance.
This side-ways and slightly downward drift with narrowing volatility creates the "handle."
Current Price: $55.09
It's approaching the neckline/resistance zone at $63.89.
Implication:
The Cup and Handle is a classic bullish continuation pattern. A breakout above $64 with strong volume would confirm the pattern, potentially leading to a measured move target of approximately:
Conclusion: Technical Outlook
Pattern: Cup and Handle
Breakout Trigger: Daily close above $64 with volume > 12M
Target Zone: $90–$100
Support: $51 (handle base), $45 (major swing support)
Risk Management: Ideal stop loss below handle support (~$50)
Regulatory Note: We are an independent development team. Our services are not registered or licensed by any regulatory body in India, the U.S., the U.K., or any global financial authority. Please consult a licensed advisor before making trading decisions.
NBIS trade ideas
NBIS Nebius Group Among My Top 10 Picks for 2025 | Price TargetNebius Group N.V. (NBIS) presents a compelling bullish case for a potential doubling of its stock price by the end of 2025, driven by several fundamental factors that highlight its growth trajectory within the rapidly expanding AI infrastructure market.
NVIDIA Corporation (NVDA) has made a significant investment in Nebius Group N.V. (NBIS), contributing to a $700 million funding round aimed at expanding Nebius's AI infrastructure capabilities. This investment aligns with NVIDIA's strategic focus on enhancing its presence in the rapidly growing AI market.
Explosive Revenue Growth:
Nebius Group has demonstrated remarkable revenue growth, with Q3 2024 revenues reaching $43.3 million, representing a 1.7-fold increase compared to the previous quarter and a staggering 766% year-over-year increase. This surge is primarily driven by the company's core AI infrastructure business, which grew 2.7 times quarter-over-quarter and 6.5 times year-over-year. Analysts expect this momentum to continue, projecting annual revenues of approximately $731.96 million for 2025, reflecting a robust demand for AI-centric services and solutions.
Strategic Investments in AI Infrastructure:
The company is heavily investing in expanding its GPU cluster capabilities and data center capacity, with plans to allocate over $1 billion towards these initiatives. This strategic focus on enhancing AI infrastructure positions Nebius to capture significant market share as the global demand for AI technologies continues to rise. The annualized run-rate for its cloud revenue has already surpassed $120 million, indicating strong customer adoption and a growing client base that includes Fortune 500 companies.
Strong Market Position and Competitive Advantage:
Nebius Group is uniquely positioned within the AI infrastructure landscape, specializing in full-stack solutions that cater to developers and enterprises looking to leverage AI technologies. As businesses increasingly prioritize AI integration into their operations, Nebius's comprehensive offerings make it an attractive partner for organizations seeking to enhance their technological capabilities. The company’s ability to provide scalable solutions will be crucial as the demand for AI services expands.
Healthy Financials and Cash Reserves:
As of September 30, 2024, Nebius reported cash and cash equivalents totaling approximately $2.29 billion, providing a solid financial foundation to support its growth initiatives without excessive reliance on debt. This strong liquidity position allows Nebius to invest aggressively in technology and infrastructure while maintaining operational flexibility 14. Additionally, with gross margins projected to remain robust at around 55% in 2025, the company is well-positioned to improve profitability as revenues grow.

NBIS 55 BREAKOUT in the works!NBIS is an AI darling and a big momentum stock. When it goes it goes! it has been testing this 55 level for some time now.
We recently had a big GS upgrade that "woke" it up. A rest day here and another one will let the 9ema catch up to it and allow for a big breakout. If we take out this trendline at 55 ill put the stop 9ema and swing this.

NBIS Bullish Technicals.
NBIS Fundamentals.
1. Massive Growth – The stock’s up a jaw-dropping 138% in just 3 months!
2. YTD Beast Mode – Up 81.6% so far in 2025.
3. Momentum Heating Up – Gained 36.9% over the last month alone.
4. Super Low Debt – Debt-to-equity at just 0.06 — strong balance sheet!
5. Sitting on Cash – Over $6.42/share in cash with a killer 9.59 quick ratio.
6. Insider Confidence – 20.71% insider ownership, they believe in what they’re building.
7. EPS Looking Strong – Projected +41.91% EPS growth next year.
8. Big Money Watching – 33.26% institutional ownership, eyes are on this.
9. Revenue Turnaround – Insane 381% sales growth QoQ, the shift is real.
10 Wall Street Thumbs Up – Consensus Buy rating, score of 1.25.
NBIS Technicals:
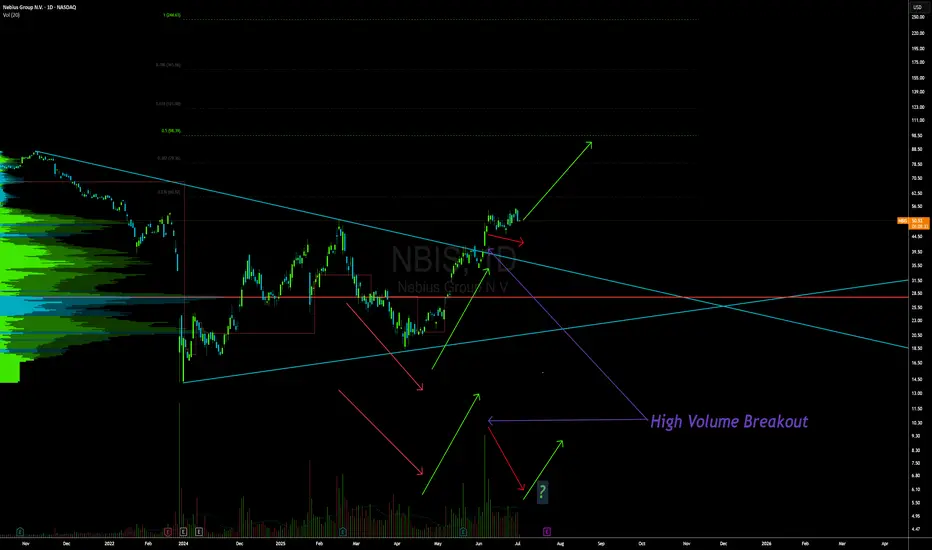
1. High-Volume Breakout spotted on the weekly chart — clear signal buyers are stepping in.
2. Broke out of long-term downtrend resistance with authority. Consolidating on low volume.
3. Price holding above key EMAs — bullish structure intact.
4. Fib targets in sight with potential room to stretch toward $90-$120+.
5. Volume expansion confirms real accumulation happening.
Watching for continued strength as this beast tries to reclaim lost ground and ride that momentum wave. With fundamentals this solid and technicals aligning.
NBIS - bullish cross on 50 and 200MAThe golden cross hasn't happened yet but is about to happen. Keep this in your radar.

NBIS Swing Trade Plan – 2025-06-09🧾 NBIS Swing Trade Plan – 2025-06-09
Bias: Moderately to Strongly Bullish
Timeframe: 3–4 weeks
Catalysts: AI sector strength + institutional buying + momentum breakout
Trade Type: Long equity (shares)
🧠 Model Summary Table
Model Direction Entry Price Stop-Loss Target Price Risk Size Confidence
DS Long $48.28 $44.50 $54.00 1% of account 70%
LM Long $48.50 $46.08 $55.75 ≤5% of account 80%
GK Long $48.28 $43.80 $57.90 2% on $10K 70%
GM Long $48.28 $43.80 $57.90 2% on $10K 75%
CD Short $48.30 $50.50 $42.75 2–3% of account 72%
✅ Consensus: Long bias (4 out of 5)
📈 Core Setup: Trend-following continuation play
⚠️ Outlier: CD favors a tactical short due to overbought RSI
🔍 Technical & Sentiment Recap
Trend: Strong bullish across M30 / Daily / Weekly timeframes
Momentum: RSI Daily (82.9) & Weekly (71.9) → overbought
Volume: 199% above average = strong institutional interest
Volatility: VIX ~16.8 = low risk-on environment
Narrative: AI/Nvidia tailwinds + hedge fund accumulation
✅ Final Trade Recommendation
Parameter Value
Instrument NBIS
Strategy LONG (shares)
Entry Price $48.28
Stop-Loss $44.50
Take-Profit $55.75
Holding Period 3–4 weeks
Size 44 shares (on $10K portfolio, ~2% risk)
Confidence 75%
Entry Timing Market open
🎯 Rationale: Riding strong institutional buying, macro tailwinds, and multi-timeframe bullish trend.
⚠️ Risk Checklist
Overbought RSI may lead to temporary consolidation
Bollinger upper band breakout suggests volatility ahead
Sentiment cooling around AI/Nvidia could slow rally
Broader market volatility (e.g., VIX spike > 20) could reverse trend
📊 TRADE DETAILS SNAPSHOT
🎯 Instrument: NBIS
📈 Direction: LONG
💵 Entry Price: 48.28
🛑 Stop Loss: 44.50
🎯 Take Profit: 55.75
📊 Size: 44 shares
💪 Confidence: 75%
⏰ Entry Timing: open

NBIS should correctNBIS has pumped yet again into the weekly supply zone. Advanced stochastic is on the high end, and there is a huge gap in the middle of the range. It would be realistic to see 32$ again given how volatile this stock is. BBWP has remained elevated for months.

NBIS : Long worth TryingNebius group stocks are technically strong.
The downtrend since November 9, 2021 has been broken and the price is trading above the 50 and 200-period moving averages.
When we draw a medium-term Fibonacci level, we can take the take profit point at 0.618 and the stop-loss point at 0.382.
This gives us a Risk/Reward Ratio of 3.00.
A small position size is ideal.
Risk/Reward Ratio : 3.00
Stop-Loss : 43.46
Take-Profit : 60.00

Nebius (NBIS) Powers AI Workloads With GPU Dev ToolsNebius Group N.V. (NBIS) builds full-stack AI infrastructure using GPU-accelerated cloud platforms, data-center hardware, and developer tools. The Amsterdam-based company—spun out from Yandex—supports AI workloads through Nebius.AI, Toloka AI, Avride, and more. With strong investor backing including Nvidia, Nebius aims to challenge major cloud providers as demand for AI model training and generative applications surges.
On the chart, NBIS recently printed a confirmation bar with rising volume, pushing above the .236 Fibonacci level and entering the momentum zone. This indicates growing buyer interest and a possible continued uptrend. Traders may use that .236 level as a trailing stop with the Fibonacci snap tool, helping manage risk while riding the move.

Long NBIS as it completed Intermediate waves I and III believe that now NBIS is in wave III.
Wave II retraced almost all the wave I.
I will try to update on smaller waves as they progresses.

NBIS watch $23 below, $24.5 above: Double Fibs defining key zoneNBIS recovering quite well but currently retracing.
Watching double fibs below for support at %23.01-23.03
If we bounce then target will be double at $24.57-24.59

Base Breakout Setup NBISwith the market picking up steam this NBIS is ripe for a base breakout setup. this 25 zone is huge. if we can break through it and reclaim the 50sma and the general market can stay strong we could have a runner here.
with META and MSFT having positive reactions to the earnings the tech market is starting to solidify.
Risk is at yesterdays lows. Like this for a shot at something with a solid base that can play catch up.
Window To Be ClosedHaving taken the profit of the long position I had opened 4 weeks ago I am turning my my view to the downside now. On April 30thwe've got a fine wide window which has to be closed. On April 23rd there was another window which confirms the importance of this level.

Forcing InIt looked like a beginning bottom already yesterday. Today's candle body forcing into the previous one seems to confirm the bottom. This is the more that today's candle has a long wick, i.e. that the attempt to fall and remain under yesterday's candle body has failed.

longLong level. Looking pretty good by feel. I just feel that long bitch. I visualise and it happens.
Feels good winning.

NBIS +80%Investing in Nebius AI could be promising due to the booming demand for AI cloud services, especially if it offers cost-efficient, high-performance AI infrastructure or unique proprietary models. If backed by strong partnerships or competitive pricing, it may carve out a niche against giants like AWS and Google Cloud

Range ExceededFor 2 1/2 Weeks we have been trading within a range of 19 % with no direction.
Today we have exceeded the range together with the broad market.
As we had declined for over 1 month this may be seen as the beginning of an upward correction.
The window that had been opened at March 5th has been closed today. Thus may be we we will see a littledecline first to retest the range before the price ma go up.

Nebius $26.35 buy Looking at the 30 candle chart this looks like a good point to get back in.
I’m looking at 6-12 time frame, expecting volatility

NBIS: Updated Chart & New Key Level to WatchNebius came very close to my S3 level before catching a small bounce, but this support remains critical. If it fails, I believe we’ll be looking at a move into the teens, with S4 and my revised PT now set at $17.55.
Given overall bearish market sentiment, I think there’s more downside ahead, and I’ll be starting a position at S4 if we get there. Watching closely to see how this plays out.

NBIS deep demand zone (buy)I have been adding to this position here and selling covered calls to accumulate more cash. I am starting to really like this stock for selling options and I am starting to build conviction in the thesis. The company although risky should remain hot this year with juiced premiums.
You will note the stock is deep in the weekly demand zone here. Stochastic momentum has shifted and reset. We are below all moving averages.
My plan:
I have been very successful in selling covered calls and closing them if they are 50% in profit the first day or 70% profit the second day. I have also been selling puts in these demand zones and adding shares. I would like to get to 1,000 shares to wheel this like I had been doing with hims.

NBIS: Revised Chart, Tracking the Next SupportAs outlined in my previous chart, NBIS tested both S-1 ($38.87) and S-2 ($34.01) before ultimately breaking through. Now trading at $28.80, I’ve plotted a new S3 at $24.41, which looks entirely achievable if selling pressure continues.
So far, there’s no clear sign of a reversal, and momentum remains to the downside. The key question now is whether buyers step in at S-3 or if the stock continues searching for lower support.
Watching closely—stay tuned for further updates.

NBIS setup bullish I have added another 100 shares in the last few days we we dipped back into the demand zone and teal trend. My plan has been selling calls as we approach supply, and puts as we approach demand. I take that money to buy more shares. This ticker has been great for premiums so far as it has the hot narrative of NVDA/Ai attached to it which juices premiums. I expect this stock to double from here this year or more.
My plan:
Sold CSP here and bought 100 more shares as a DCA
Strong bounce on the teal momentum trend line as well
Nice reset to momentum
I will sell covered calls as we breach 39$

#NBIS major support trendline will come at around 28. am buying #NBIS major support trendline will come at around 28.
am buying this and will take my loss with a daily close below 25.
if 28 holds then expect a return towards 40 level.
