NCSM - Big Volume and Price PumpNot sure what happened here. Couldn't really see any significant news. Massive 100% price pump on volume before closing up around 13%.
Will be interesting to watch over the next couple of days to see what it does next.
Next report date
—
Report period
—
EPS estimate
—
Revenue estimate
—
3.35 USD
6.59 M USD
162.56 M USD
667.71 K
About NCS Multistage Holdings, Inc.
Sector
Industry
CEO
Ryan Hummer
Website
Headquarters
Houston
Founded
2006
FIGI
BBG00G6DYB34
NCS Multistage Holdings, Inc. engages in the provision of engineered products and services that facilitate the optimization of oil and natural gas well completions and field development strategies. It offers fracturing systems, repeat precision, tracer diagnostics, and well construction. The company was founded by Robert Nipper and Marty Stromquist in 2006 and is headquartered in Houston, TX.
Related stocks


NCSM - Big Downtrend Over?This stock has the potential for some upside movement if you buy at low levels. 80% retracement completed over the last year. Possible gains on a retracement up if it breaks above the EMA34.
NCS Multistage Holdings, Inc. is a provider of engineered products and support services for oil and natural

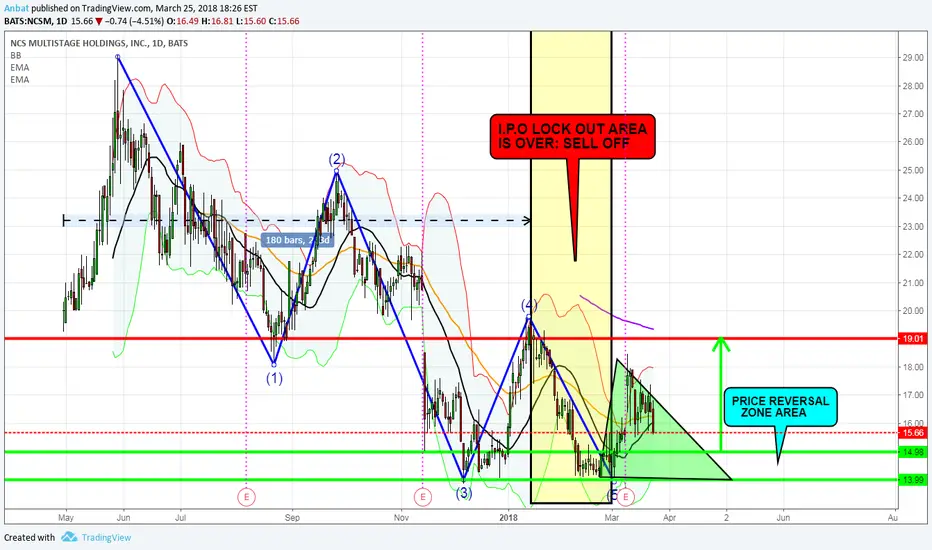
NCSM (Price Reversal Zone Area is $14-$15 Area)Please refer to chart for further information and thoughts on where NCSM been and going in the near future. Elliot Impulse Wave Bearish (12345) was just completed and beginning of Bullish run will happen soon. PA is still going down this coming week, look for support at major level soon. Good Luck.
See all ideas
Summarizing what the indicators are suggesting.
Neutral
SellBuy
Strong sellStrong buy
Strong sellSellNeutralBuyStrong buy
Neutral
SellBuy
Strong sellStrong buy
Strong sellSellNeutralBuyStrong buy
Neutral
SellBuy
Strong sellStrong buy
Strong sellSellNeutralBuyStrong buy
An aggregate view of professional's ratings.
Neutral
SellBuy
Strong sellStrong buy
Strong sellSellNeutralBuyStrong buy
Neutral
SellBuy
Strong sellStrong buy
Strong sellSellNeutralBuyStrong buy
Neutral
SellBuy
Strong sellStrong buy
Strong sellSellNeutralBuyStrong buy
Displays a symbol's price movements over previous years to identify recurring trends.
Frequently Asked Questions
The current price of NCSM is 30.21 USD — it has decreased by −1.70% in the past 24 hours. Watch NCS Multistage Holdings, Inc. stock price performance more closely on the chart.
Depending on the exchange, the stock ticker may vary. For instance, on NASDAQ exchange NCS Multistage Holdings, Inc. stocks are traded under the ticker NCSM.
NCSM stock has fallen by −0.96% compared to the previous week, the month change is a −6.68% fall, over the last year NCS Multistage Holdings, Inc. has showed a 74.81% increase.
We've gathered analysts' opinions on NCS Multistage Holdings, Inc. future price: according to them, NCSM price has a max estimate of 8.10 USD and a min estimate of 8.10 USD. Watch NCSM chart and read a more detailed NCS Multistage Holdings, Inc. stock forecast: see what analysts think of NCS Multistage Holdings, Inc. and suggest that you do with its stocks.
NCSM reached its all-time high on May 30, 2017 with the price of 581.40 USD, and its all-time low was 6.24 USD and was reached on Apr 3, 2020. View more price dynamics on NCSM chart.
See other stocks reaching their highest and lowest prices.
See other stocks reaching their highest and lowest prices.
NCSM stock is 1.75% volatile and has beta coefficient of 0.65. Track NCS Multistage Holdings, Inc. stock price on the chart and check out the list of the most volatile stocks — is NCS Multistage Holdings, Inc. there?
Today NCS Multistage Holdings, Inc. has the market capitalization of 76.75 M, it has decreased by −0.43% over the last week.
Yes, you can track NCS Multistage Holdings, Inc. financials in yearly and quarterly reports right on TradingView.
NCS Multistage Holdings, Inc. is going to release the next earnings report on Jul 31, 2025. Keep track of upcoming events with our Earnings Calendar.
NCSM earnings for the last quarter are 1.51 USD per share, whereas the estimation was 0.79 USD resulting in a 91.28% surprise. The estimated earnings for the next quarter are −1.29 USD per share. See more details about NCS Multistage Holdings, Inc. earnings.
NCS Multistage Holdings, Inc. revenue for the last quarter amounts to 50.01 M USD, despite the estimated figure of 44.69 M USD. In the next quarter, revenue is expected to reach 27.74 M USD.
NCSM net income for the last quarter is 4.06 M USD, while the quarter before that showed 3.47 M USD of net income which accounts for 16.85% change. Track more NCS Multistage Holdings, Inc. financial stats to get the full picture.
No, NCSM doesn't pay any dividends to its shareholders. But don't worry, we've prepared a list of high-dividend stocks for you.
As of Jul 27, 2025, the company has 252 employees. See our rating of the largest employees — is NCS Multistage Holdings, Inc. on this list?
EBITDA measures a company's operating performance, its growth signifies an improvement in the efficiency of a company. NCS Multistage Holdings, Inc. EBITDA is 11.76 M USD, and current EBITDA margin is 5.93%. See more stats in NCS Multistage Holdings, Inc. financial statements.
Like other stocks, NCSM shares are traded on stock exchanges, e.g. Nasdaq, Nyse, Euronext, and the easiest way to buy them is through an online stock broker. To do this, you need to open an account and follow a broker's procedures, then start trading. You can trade NCS Multistage Holdings, Inc. stock right from TradingView charts — choose your broker and connect to your account.
Investing in stocks requires a comprehensive research: you should carefully study all the available data, e.g. company's financials, related news, and its technical analysis. So NCS Multistage Holdings, Inc. technincal analysis shows the sell today, and its 1 week rating is neutral. Since market conditions are prone to changes, it's worth looking a bit further into the future — according to the 1 month rating NCS Multistage Holdings, Inc. stock shows the buy signal. See more of NCS Multistage Holdings, Inc. technicals for a more comprehensive analysis.
If you're still not sure, try looking for inspiration in our curated watchlists.
If you're still not sure, try looking for inspiration in our curated watchlists.