NASDAQ Will Rise Next days (weeks) !NASDAQ Will Rise Next Weeks
I Advais You to keep it in the portfolio
Target : 180 . 10 USD
StoopLoss : 130 . 00 USD
NDAQ trade ideas

NASDAQ : PennantThe NASDAQ should continue to grow in few weeks after bouncing in the Pennant figure.

NASDAQ INC, Possible nice Buy Zone!As you see the price is rising with similar stages.
So, we can predict the next buy zone.
If it will accumulate its power like earlier we can open buy after the breakout.
Push like if you think this is a useful idea!
Before to trade my ideas make your own analysis.
Thanks for your support!


NASDAQ looking very weak on multiple indicatorsI continue to cobble together a trading system that will help me let my winners run while finding potential reversal points as I have gotten fairly good at buying the dip or finding longer term reversals but I leave to much on the table or I get out too soon. So lets break this down:
The VSTOP system is pretty simple. The regular setting helps track areas of support and resistance and you can look at closing a position when it flips. When it does flip you have a secondary back up at the Multiple Time Frame VSTOP. Often you can get quick movements from the VSTOP to the VSTOP MTF. The current target for that move would be around $121.
The On Balance Volume EMAs is one of my favorite indicators. Like many indicators it is a bit easier to but the dip than it is to short the top because of how difficult shorting can be. The purple circle does show an interesting consolidation below bearishly crossed 10 and 20 EMAs just above the 100 EMA. Should we get the expected move off the VSTOP the OBV situation would probably drive OBV below the 100 EMA and single worse things to come.
Further that: the OBV showing hidden bearish divergence peak to peak as shown by the red arrow. That is very crucial and the OBV beneath the EMAs shows a lot of weakness.
The blue circles on the MACD show that we have a very similar bearish cross compared to the black squares and purple circle. The MACD has a potential to cross zero and the MACD histogram is showing classic bearish divergence. Somewhat painfully for me is I know uptrends often have three highs (simple elliot wave) and the MACD helps show us where those highs are technically. I shorted the second high poorly.
And finally, the 20D SMA is in a position to act as resistance.
Based on this system I am cobbling together we could short and place a stop above the VSTOP and either take profit at the MTF VSTOP or look for a fib retracement of this uptrend. You could also zoom out and look for a wider support.
If the price action breaks the VSTOP bullishly the setup is negated. If the OBV EMA situation is no longer bearishly stacked the setup is negated. If price action goes to the MTF VSTOP then bounces up the trade is just a swing trade and not a longer term trade.

Un HECHO fundamental, nasdaq UN hecho fundamental para una correccion de precio , beneficio riesgo mas que suficiente para entrar a vender y esperar beneficios a largo plazo


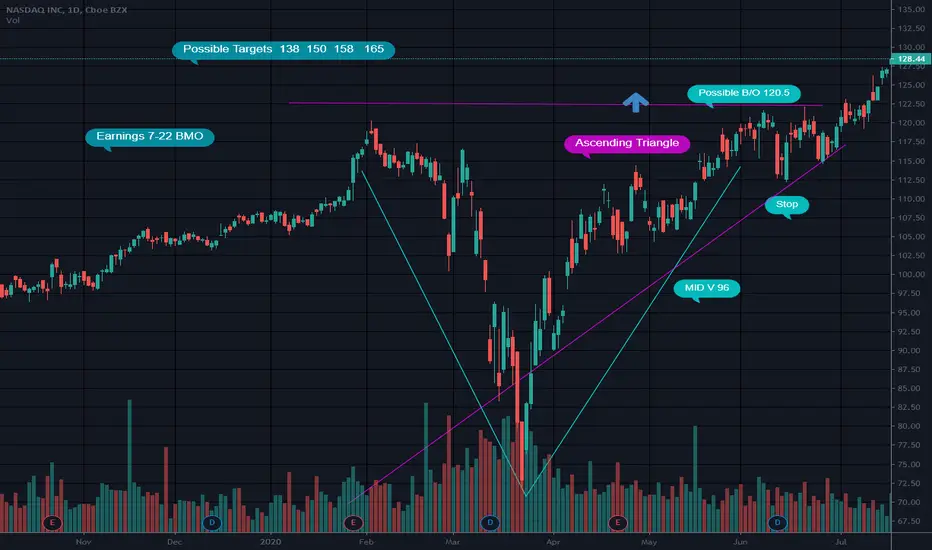
V Bottom Rising wedgeNDAQ is riding the bottom trend line of it's V Bottom and rising wedge patterns. It broke up from an ascending triangle at 123ish...so possiblly strong support at that price. The top trend line of a triangle can serve as support after the break out. It serves as resistance before the break out
It has actually broken the rising wedge bottom trend line by a smidgen (is that a word) lol
Seems to be consolidating. Rising wedges have a bearish bias so I will stay on the sidelines and watch this one for a bit. I would go long when I see that the rising wedge pattern does not interfere or is broken one way or the other. Some stocks do not fall out very far. Others do..ie LLY..
Monthly candle is a red doji so not help there. Bollinger bands are contracting around price which usually means a break up or down is coming
Not a recommendation


My Vision for Nasdaq is buying My Vision for Nasdaq is buying from the bellow zone or from the level where in


NDAQ Setup We Se Here The Price Break Out Trend Area + Break Out Resistance Area So >> We Can See More Up For Upper Resistance Area

Last push before the big correction.Nasdaq on the monthly is currently in the overbought region, but according to Fibbonaci extensions it could push a little bit more to the 145 levels before dropping to approximately 99 or lower.

NASDAQ vs Compound InterestBy comparing Nasdaq with historical returns it seems Nasdaq returns are aligning with 12% annually compounded rate. If Nasdaq has similar potential in the future this graph can help in understanding oversold or overbought positions for the long term.
If the index is far below the compounding rate line, it indicates that the index has the potential to give more returns down the line. The longer gap and longer duration have a higher probability.


Is the Bearish signal confirmed for NASDAQ?I would say yes.
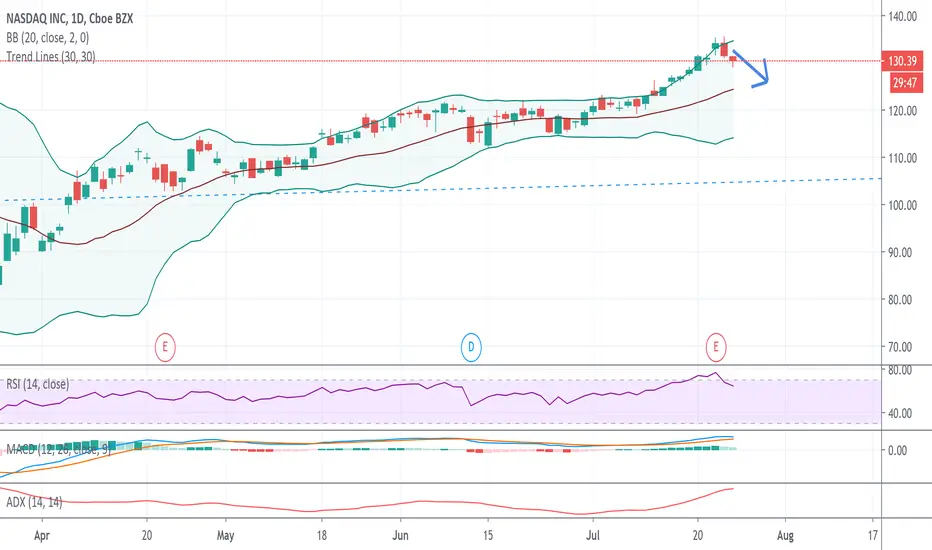
NASDAQ has been in an upward trend for a while, however, every time the price touches the upper band, it retraces back to the middle. Mostly, it has been moving within the Bollinger bands. Now, the price already touched the upper band, so I would say this time it could bounce back to the middle as before.
RSI just goes through an overbought point, which to me is a bearish signal. Also, MACD is about to cross, which is a reversal signal.
Let’s expect the price goes down to the middle line of the Bollinger bands in the near future.
NASDAQ DOWN to level min 128.92 and UP to max 138While the price on NASDAQ will down to the target support ranges 128.92 - 125, and then will continue the bullish trend until the first target resistance is at level 128 and will continue the maximum resistance level at 138-141.
Regards,
Tony Wong
24 Jul 2020


Ascending Traingle V BottomBreak from V bottom and from ascending triangle
Earnings this week 7-22 BMO
not a recommendation
my stop is at 112