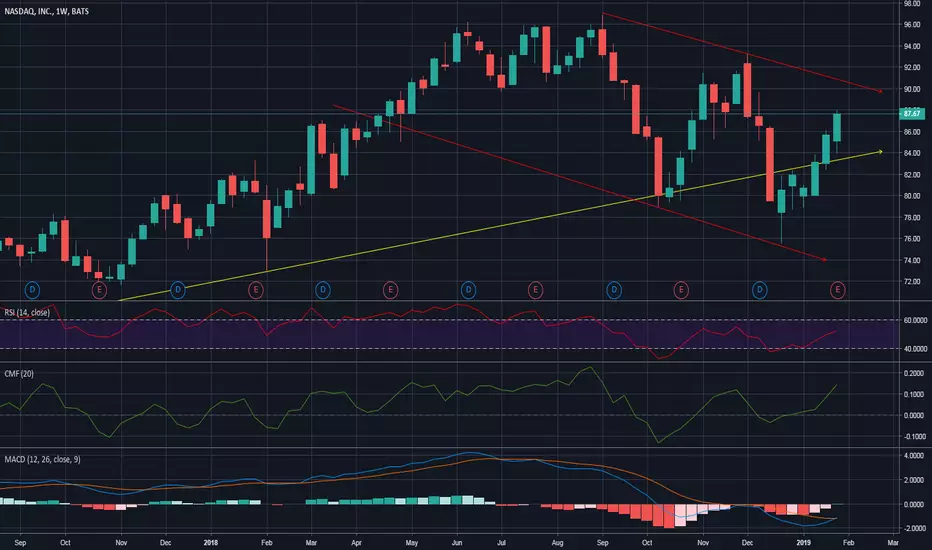
NASDAQ Trading Opportunity from Weekly Chart!!As you can see on the chart, NASDAQ is currently in a weekly down trend and approaching the most recent lower high.
This is not a detailed analysis and is not hard to execute, rather, just a good risk:reward shorting opportunity in which the trend is my friend.
Please note, if this downtrend is broken, which is hard to anticipate at the moment, then there will be plenty of opportnities to go long and make that loss back.
I am the Unemotional, Devotional Trader society doesn't deserve, but needs!
NDAQ trade ideas

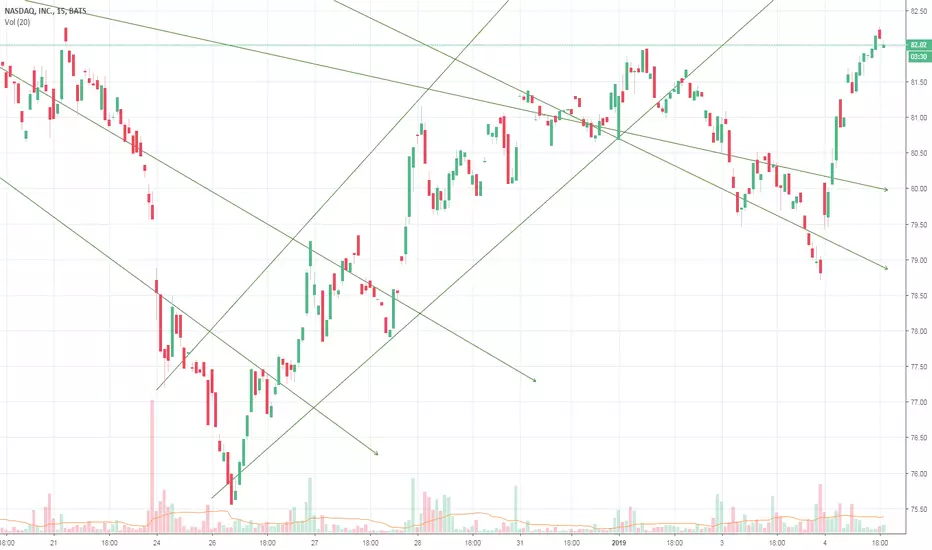
How to surf NASDAQ like a Boss. +62% in 175 days strategy.Hello everyone,
I just wanted to share one of my strategies since some of our clients have asked for it.
This is a strategy that I use for trading more significant accounts. But I've found out that it works really well even with small ones, especially if you use leverage.
On this strategy, we use Spectro M2 indicator by Hypester.org and Alpha-Omega Index , also by them.
The features we are seeing and have to be considered, I don't wanna get technical with names, so I'll keep this educational:
#1 The pivotal lines and it's green/red zones.
#2 The arrows that point an oversold/overbought area
#3 The warnings that give that extra confirmation
#4 The blue backgrounds that tell you that the current trend is exhausted
Now observe how I use it on the chart.
All the stop-losses, entries, take-profits & targets are there.
This strategy has yielded +62% in the last 175 days, and its conditions are relatively easy for anyone to follow.
I use this strategy for many other assets and timeframe - I shared it because I feel like it's one of the simplest and yet robust ones I use.
From that, you can guess what the next trade is, right? Let me know what you think below.
Good luck with your trading,
Specter

NASDAQ - Lets wait for price to break trend line
- WAIT, for pull back for confirmation to Execute
-

NDAQ- fractalized sketch of SPX
- one pure clear daily doji
- power reached previous tops
... it should go down..........
NASDAQNasdaq, how do I think? Here there is no definitive collapse in this market without first drawing a significant M or double maximum .... THIS THINK AND THIS BELIEVE HAPPENS ... ONCE THAT WE WILL HAVE THIS. WE WILL CONCENTRATE ON THE CPRIPTOVALUTE

NASDAQ going FULL BTC Bear Marketthere's a saying that goes :
Easiest way to trap a bull is to put
hay on the top. coz all they know is climbing up
going down can be a challenge they might as well jump off
the cliff and die
Nasdaq looks like the top if you ask me
2019 will be opening with a slide
#bullishOnChaos


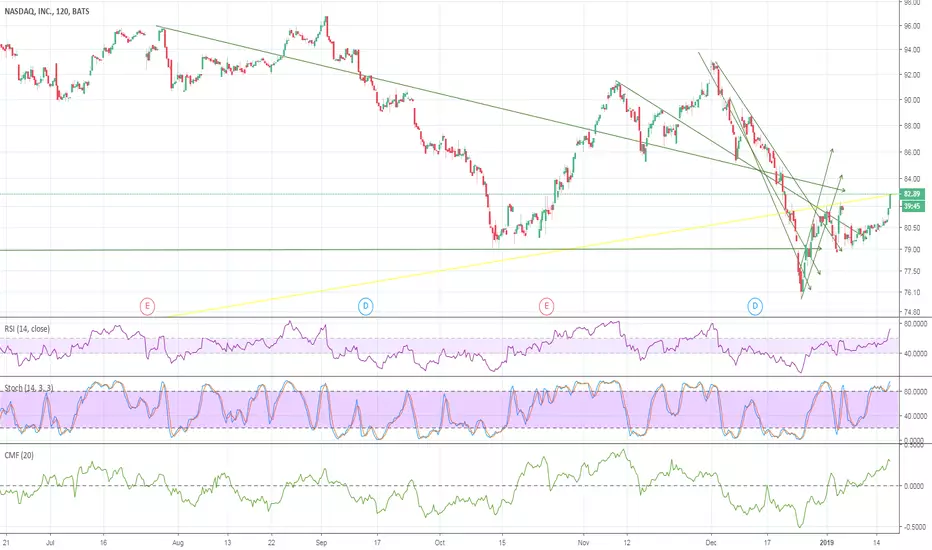
#NASDAQ Signal Big Opportunity As you can see in the graph above we are in a bearish channel almost 4 months and the price just touching resistance!
The second reason to sell is the big resistance on W1 Kijun Sen (Ichimoku indicator)
Sell NASDAQ
Entry Price: 6685
Stop Loss: 6800
Take Profit: 6332

NDAQ - going down...Japan is on a reverse H&S with a confirmed jump shoulder - strong reversal signal, without a bull being confirmed yet (good chances though)
China returns after testing one last bastion SHCOMP 2467 and if not confirming a bull trend fast enough - we may read about them just in papers for century 22 - very weak chart on Monthly
SPX - looks like the heads comes off - with chances to recover... still.
If this is so - we may see another few decades of Japan dominating the world next to USA. History does repeat itself... or maybe it's me...
Keep your head in the game and never go full retard. Always keep learning and reading.


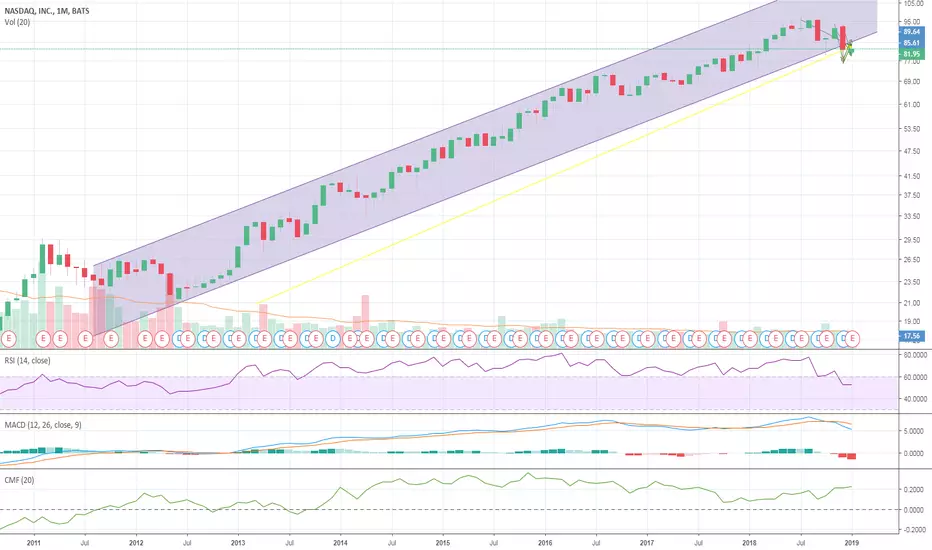
Nasdaq possibly will switch back to bull market in Aug 2019 As we can see once again with the Nasdaq there is that very clear M pattern before the 2008 market crash which looking back now could have been a very clear indication towards the 2008 crash. (Lookin at the monthly candlestick chart fully zoomed out). last year 2018 we saw the downward trend for the first half of the M once again play in motion.
This to me indicates yet again as I've said before that we aren't going to go through any sort of recession until about 2023-2025.


Worst case scenario for NasdaqI would like to see a retrace of this magnitude before any significant moves

NDAQ in No Man Land- this is a decision point in the markets
- do not trade or if you are short on the long run it may be ok (65%)
my 2 cents.
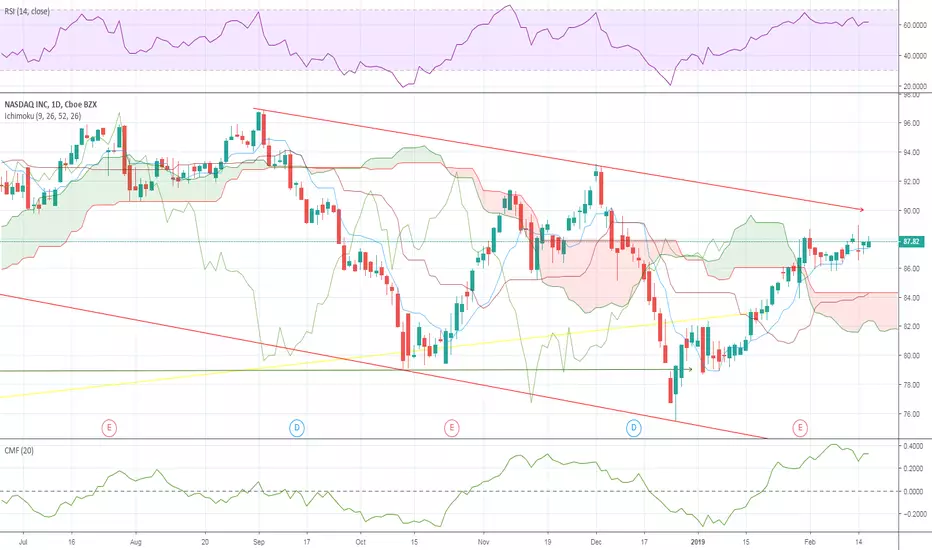
NDAQ - Early PartyRSI penetrated 50 level
FIB 0.618 down
CMF weakened and the signs are strong that it may faint soon
We may cross in a quick drop 10 points...

NDAQ - Island Reversal
- the cones will be crossed in high speed
- CMF is zeroed
This analysis is dedicated to The_Unwind... best coach you can find and a true Market Master.

NDAQ Fib Retracement - Fib Levels perfectly respected
- i guess is hard to play out 3000 companies
- CMF is fading out on 15Min
Hold !


