NASQAUCKPrice may push a little further down and hit the $202.25 support level. After that, I'm anticipating price to retest the $207.75 level and it will either fail or break it. Personal, it looks like a break and restest but we'll how it plays out. What do you think?
NDAQ trade ideas

Chart NDAQ compare to M2 and Fed Balance sheetNDAQ has been on a rise these last years but is NDAQ actually going up or does the Dollard value just going down ?

Nasdaq intakeI see a correction followed by an big impulse...If you ask me I would say it's going down.
But let's be reactive and not predictive, For now let's monitor how the market re-acts.🙏
SKILLING:NASDAQ

sellThere is noticeable liquidity in the market, in addition to the fact that the chart respects the red trend as well as the yellow (if you saw the yellow trend from the beginning, you will notice that), the obv indicator and the ocsalor indicate that there are many traders who are trying to exit now, so I see that the price It will decrease slightly (about 3% or more)

sellThere is noticeable liquidity in the market, in addition to the fact that the chart respects the red trend as well as the yellow (if you saw the yellow trend from the beginning, you will notice that), the obv indicator and the ocsalor indicate that there are many traders who are trying to exit now, so I see that the price It will decrease slightly (about 3% or more)

NDAQ - UnstoppableNDAQ shows no sign of slowing down. It looks like momentum is there for a run to 115 and maybe 220.

NDAQ This wedge really scares me.
If it breaks to the downside, we can expect a drop between 10% to 15%.

NDAQ it's will be down We can say that it will down in the coming hours, but it cannot be denied that the content in this analysis is subject to change at any time without notice and is provided for the sole purpose of assisting the trader in making an independent investment decision. NASDAQ:NDAQ

NASDAQ : UPTREND| SWING TRADING PULLBACK | LONG SETUP ⚡️Welcome back Traders, Investors, and Community!
Check the Links on BIO and If you LIKE this analysis, Please support our Idea by hitting the LIKE 👍 button
Traders, if you like this idea or have your own opinion about it, please write your own in the comment box . We will be glad for this.
Feel free to request any pair/instrument analysis or ask any questions in the comment section below.
Have a Good Day Trading !

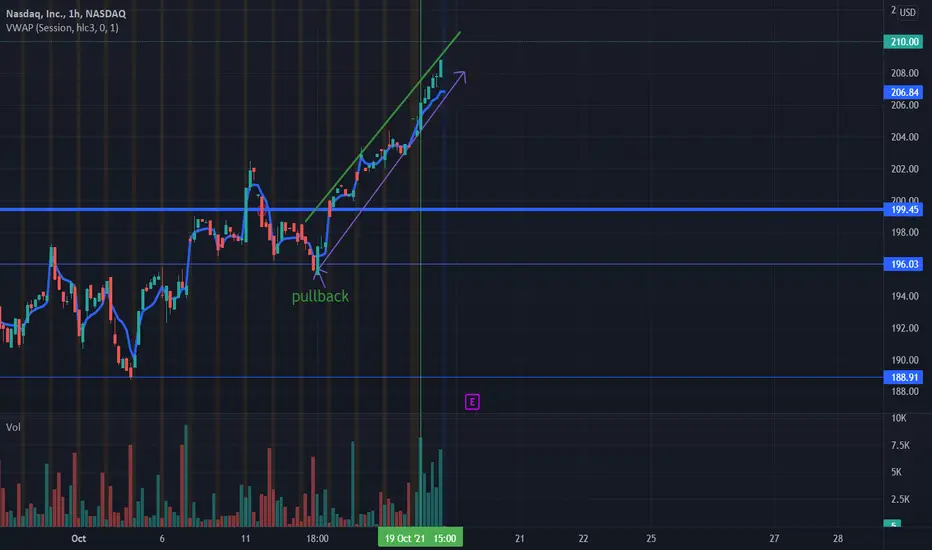
Don't panic it's just a gather strenghlast day as i told you, the market can go down a little bit to gather strengh . i didn't expect to go down until the 199.45 res . as we can see here the market make a clear aand long wick , so the buyers still in the market and pull it up . we can assist either in this wave with a buyer position .

Nasdaq surprise usNQ make a pullback on res , and he's continuing to go up with high volumes today it's a sign of a big uppertrend coming .No matter if he goes down a little bit it's just a gather strength to go further.
Long-Term Wealth Generation with NDAQLong-Term Wealth Generation With Nasdaq Inc.
" After covering CME and Cboe, it's time to look at another wealth-generating powerhouse: Nasdaq. The company has tremendous free cash flow capabilities thanks to a fantastic business model and high expected future growth. The stock isn't cheap, but I think it's still a good deal for dividend growth investors with a long-time horizon.
It's time to take a look at Nasdaq, Inc. (NASDAQ:NDAQ). Not the index but the company. I had the company on a list for a very long time, but I never took the time to actually dive into its business models and financials. In the recent past, I discussed two of its peers: Cboe Global Markets (NYSE:CBOE), and CME Group (NASDAQ:CME), which is the reason why I picked up my NDAQ research again. I think NDAQ is a great stock for long-term investors despite its relatively low dividend yield and the fact that the stock has rallied more than 40% this year. Nasdaq is a great investment for a number of reasons. The company benefits from higher trading volume and corporate actions like IPOs. Additionally, Nasdaq has evolved into a company that makes a fortune selling data and related services. This has caused a strong and increasing stream of free cash flow used to increase dividend payments, financial health, and buybacks. Unfortunately, these buybacks are only leading to an unchanged number of shares outstanding as it merely offsets stock-based compensation. Nonetheless, the pros easily outweigh the cons and make NDAQ a good dividend growth investment. In this article, I will give you the details.
How NDAQ Makes Money
Nasdaq is a company operating in the financial data & stock exchanges industry. The company has a $31 billion market cap and is founded and headquartered in New York. The company is flying under the radar as investors are mainly interested in the companies that are Nasdaq-listed - i.e., FANG+ stocks.
The thing about Nasdaq, and most of its peers, is that it takes some time to figure out how they make money. In the case of Nasdaq, we're dealing with a product portfolio that goes well beyond market services based on transaction revenue. Basically, we're dealing with technology & analytics (the purple area below) and the foundational marketplace core (the green area).
What this entails is that the company owns the single largest equity market in the United States. The company also has the number one market share in U.S. equity derivatives and Nordic equities (Nasdaq Baltic exchanges). Its corporate platform includes listing services like IPO's (including SPACs) and direct listings. It also includes companies that switch from alternative exchanges. In 2020, the company supported 316 IPOs, 20 switches from other exchanges, 46 upgrades from OTC, and 72 EPTs and other listings.
On top of that, Nasdaq sells proprietary data to customers and develops and licenses Nasdaq-branded indexes and financial products.
Since 2017 sales have grown by roughly 8% per year (CAGR). This was mainly caused by its booming technology-focused segments. Market technology revenue has doubled since 2016. When adding revenues from investment intelligence, the company has generated 81% growth in these segments since 2016.
On top of that, the company has plans to rapidly expand its non-trading business as it focuses on cloud-enabled market platforms, trade surveillance automation, better analytics to allow investors to be more effective, and new ESG solutions for corporate issuers.
None of this should come as a surprise as SaaS (software as a service) has been booming. Nasdaq's SaaS revenues have improved by 22% per year since 2016. As of 2Q21, these SaaS revenues account for 34% of total sales. This is expected to rise to at least 40% in 2025(!). And speaking of 2025, until then, the company expects organic revenue growth to be between 13-16% per year.
How Investors Benefit
In this case, we're dealing with a company that can easily leverage its services without the need to accelerate capital expenditures - like companies that produce physical products. Hence, the company is now able to generate close to $2.0 billion in EBITDA thanks to >55% EBITDA margins. As a result, free cash flow is close to $1.2 billion. That's a 3.9% FCF yield based on a $31 billion market cap. The company's current dividend yield is 1.15%, which means there's a lot of room to further accelerate dividends - even if FCF remains flat.
The company also engages in stock buybacks. On a TTM basis, the company has generated roughly $700 million in FCF. That's lower than usual due to investments in working capital. During this period, the company paid $331 million in dividends and bought back shares worth $536 million. However, these buybacks merely cover stock-based compensation, which is why the company's diluted number of shares outstanding has been flat for years. That's why we should view 'buybacks' a bit differently based on this context.
Nonetheless, dividend growth is great. While it might look like the company is seeing a significant slowdown in dividend growth, I should note that the company raised its dividend by 10.2% in April. That's not visible in the chart below.
The best thing is that NDAQ has delivered a ton of value. The stock has outperformed every major ETF and its 'peers' - especially on a total-return basis. This is obviously not a guarantee that this will continue, but I think it will, given the company's portfolio and ability to grow both its top and bottom line.
So, what about valuation?
The valuation isn't cheap, but it reflects the company's capabilities. Using a $31 billion market cap and $3.9 billion in expected net debt, we get an enterprise value of roughly $34.9 billion. That's roughly 17.9x next year's EBITDA. Besides that, the data also shows that the company maintains a healthy balance sheet with a net debt leverage ratio of roughly 2.0x EBITDA.
Given the company's historic valuation range, we're dealing with a somewhat lofty valuation. Since the pandemic, the valuation has moved above 16.0x. That does make sense for two reasons. First of all, the stock market's valuation has gone up. The second reason is based on the company's expected growth rates and success in the SaaS space. There's not really a need to wait for a 'cheap' valuation as that probably won't happen anyway. Unfortunately, its dividend yield is at multi-year lows. The same happened to the S&P 500 yield. That doesn't make it less bad, but it shows that investors are hungry for quality yield.
I like Nasdaq a lot. It's now the third company in this industry I want to add to my portfolio after covering CBOE and CME. Nasdaq is extremely well-positioned to benefit from growth in transactions and corporate actions and its SaaS operations. This will keep sales growth elevated and support strong growth in free cash flow. The company's yield is low, but I have little doubt that Nasdaq will generate outperforming dividend growth and outperforming capital gains on a long-term basis. The only problem I see is that its dividend yield is low. I don't like it but it doesn't stop me. It could, however, be a problem for income-oriented investors (retirees).
Last but not least, NDAQ is evolving into a data powerhouse thanks to its products and ability to grow in an area fueled by an ever-increasing need for data and real-time research solutions. Not a lot of companies can compete with that. "
- Seeking Alpha

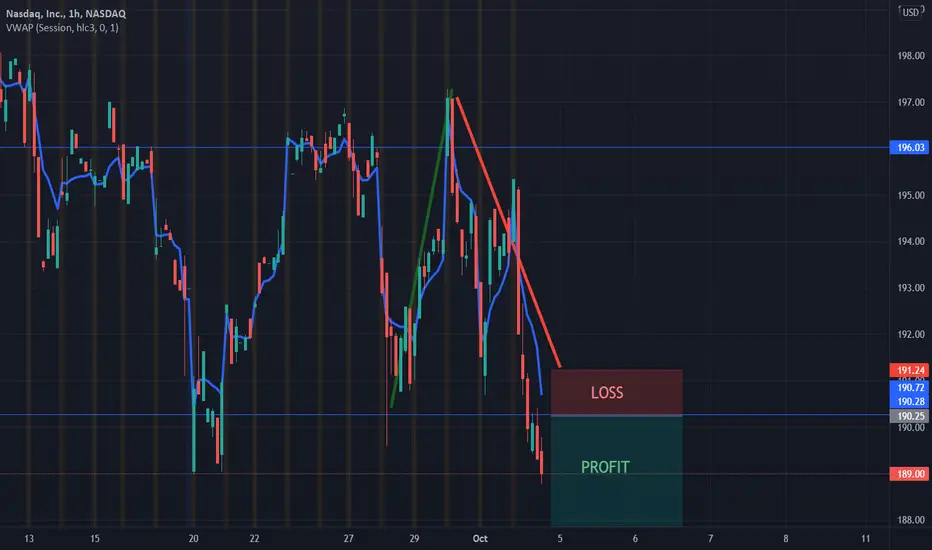
Nasdaq crashNdaq is breaking the 199.45 res + the trendline with a high volume, so this is a sign of a coming downtrend which will countinue until hitting the 196.03 res and may be further if it beak this res with a volume

Nasdaq hackNQ today is clearing his oreders with a successive big green candles and an uppertrend. so the market will go down probably to the 196.03 res and make a pullback. we can assist in this quick downtrend and also if we remark a green candle after the pullback with a position of buyers .

Nasdaq where are you going ?NQ is going down since the facebook and google issues. So that affect NQ badly and which caused this extraordinary crash with a very high volumes
HOW-TO: Cosmic Pi Cycle #1This HOW-TO tutorial will show how to setup the Mult value and how to use primary and secondary markers.
🪐 SETTINGS (Indicator 1)
Mult: 1.7
Top Markers: ON
Bottom Markers: OFF
🪐 SETTINGS (Indicator 2)
Mult: 0.85
Top Markers: OFF
Bottom Markers: ON
👩🏫 MULT
The Mult value has to be set anew for every symbol / timeframe combination. The way to set the Mult correctly is to look at the span of the entire chart and through trial and error decide where the markers look the most correct (🗠 A, C & E) . You can also look at the channel fill and set the Mult so that the highs and lows hit around the borders of the fill (🗠 F, G, H & I) .
👩🏫 MARKERS
Primary (circle) markers make sense either when the price flattens out or when they appear at or near the very extreme of a steep price rise or fall. If a primary marker appears in the middle of a bullish (🗠 B) or bearish (🗠 D) trend you can wait until the possible appearance of a secondary (square) marker (🗠 C & E) to better estimate any major price reversals.
Note that since secondary markers are a weaker signal than primary markers, the price reversal signals they may give can be related to smaller trends than those of the primary markers.

NASDAQ party is overBearish divergence on 1W TF
Party is over
Chart tell us that trend is become weaker, supported by bearish volume

NDAQ: Ascending channel, still bullish.In opposition to SPY and DJI, NDAQ still within the 1 year channel.
There is some insconsistencies within the market.
Will wait and see what SPY does and how it affects NDAQ.
Support around 180$
Stay humble, have fun, make money!
NDAQ is BullishSince 22 February NDAQ has been trading upwards, but mostly with consolidations and few pullbacks along the way

SQUEEZE INSPIRATION After the chart make a big wick with high volume with a downtrend, it's mean that the sellers had emptied their orders and it time for the buyeers to play in the market
So we think that it's time to buy now

Predict epidemic and stock During Jupiter retrograde by GannSiulung has said on air and in different articles and columns: "This time Jupiter retrograde from Pisces back to Aquarius, Jupiter retrograde back to another house is not common, there is a retrograde implication. I hope it's not a retrograde epidemic.
Today we will look at the epidemic and the stock market under Jupiter retrograde with Jahn and financial astrology.
Gann said "We have all the astronomical and mathematical proofs to determine what and how the market's perspective affects the trend of the market.
Gann wrote a romance novel "Tunnel thru' the air", in which the hero, Robert Gordon, had his birthday on June 10, 1906, when the astrological aspect of the five stars in a row, as we Chinese call it, occurred, with Mars, Jupiter, Sun, Mercury and Pluto converging between 17 and 22 Gemini. between 17 and 22 Gemini.
Two months before Robert's birth, there was a major earthquake in San Francisco, and a year later there was a difficult crop of cotton flowers in the spring and a financial panic in the fall.
After the Saturn-Jupiter conjunction in Aquarius in 2020, it will enter Pisces on May 14, 2021, and will not begin to slowly recede back into Aquarius until June 20, 2021, when Jupiter goes retrograde in Pisces.
Jupiter was also used to determine the fortune of the world by its position. So readers can see the above chart to see the US epidemic figures, from June 20 near the bottom to start rebounding.
What is the impact on the stock market? You can see that Jupiter retrograde began on June 20.
After the Jupiter retrograde, the Hang Seng Index began to top out on June 28. Neptune retrograde also joined the retrograde since June 25. You can see that the stock market fell in response.
In the Gann and financial astrology method, of course, we cannot analyze a fall just because of a bad star, and we cannot see an auspicious star as a bad sign. Instead, we have a unique method to determine the timing and the rise and fall of the stock market.
For example, in our previous article, we mentioned that "in financial astrology, I have mentioned before that there is a chance of a sideways movement in the stock market after a Saturn-Magi conjunction, for example, after a Saturn-Magi conjunction occurred in 2000 to mid-2001, the stock market moved sideways at a high level after a double top, and in fact, it repeatedly fell. So very often an astrological event occurs, the impact may not happen on the same day, but after a period of time.
As in the book "Tunnel thru' the air", the male protagonist single Robert Gordon's birth date after the autumn financial fears.
After that, Saturn, Jupiter, Neptune, Uranus and Pluto will be retrograde at the same time, we should pay attention to the epidemic and stock market changes after Uranus retrograde.
ericresearchgann-us.blogspot.com

Using Gann theory to predict the recent trend of Nasdaq
U.S. stocks have been on a tear in 2021, but have recently fallen back slightly, so how do we see the recent U.S. stock action using Gann's theory?
Since the outbreak of the pandemic last March 2020, the U.S. has launched unlimited QE. total margin debt (Margin debt) borrowing has only increased. It has hit a record high. It accounts for almost 3.7% of total U.S. GDP. This is already more than the total amount of the dot-com bubble in 2000. In response, mainstream commentators and antipodeans alike have warned of systemic risk, warning that the 1929 crash may have been the worst in U.S. history.
Mizuho Financial Group found that a large percentage of respondents intended to invest a portion of the U.S. stimulus money in stocks and bitcoin. Of the $380 billion in stimulus checks they interviewed, about 10.5% will fall into these asset classes, or $40 billion. According to the Bank of America report, the new inflows this year have not only pushed the stock market to new highs, but have also attracted new investors, not only older investors, but also a group of young retail investors. The report said, "The strong momentum of these young retail investors not only supported a strong rise in the stock market, but also prompted older investors to buy and hold, and to buy bond funds to achieve a balanced asset allocation.
The large number of new investors entering the market is not good insight,
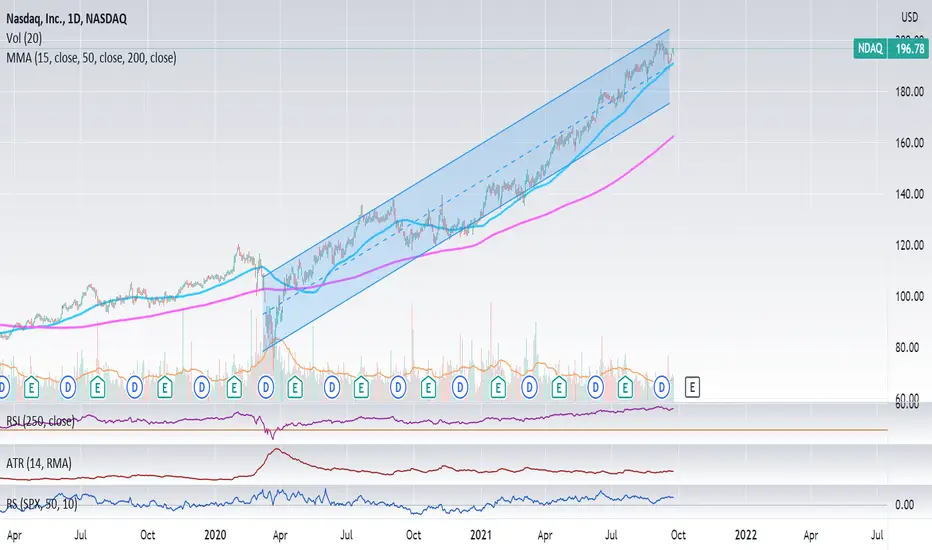
First, we use linear regression channel analysis, which is a good way to identify potential key levels of future price action by plotting the normal distribution of trends. Statistically, linear regression analysis is the use of past data to predict future trends. Linear regression channels include five equilibrium lines for reference, namely the extreme optimism line (95% optimism), the over optimism line (75% optimism), the medium line (long term trend line), the over pessimism line (75% pessimism) and the extreme pessimism line (95% pessimism).
We can see that by importing two decades of data, you can see the Nifty in an extremely optimistic situation.
In Gann, the time is the most important. The longer the market takes to cross the top or fall below the bottom, the greater the rise or fall. It is always important to consider how long the market has been up from its extreme lows or down from its extreme highs. Usually, at the end of any market, the index either moves up to a new high or down to a slightly lower level and then stops because the time cycle has run out.
Using the Gann cycle method, we found that U.S. stocks now have a cycle one month before and one month after October. But this is one of them, and there is a bigger one to come.
ericresearchgann-us.blogspot.com

NASDAQOn a Weekly basis, I expect short positions due to strong rejection on the double top. It needs to complete the M pattern. When it reaches this zone will see how the price react. I expect a retest on the daily resistance.
