NDX trade ideas

Nasdaq must hold its line, otherwise more downsideMarkets are on edge. The Nasdaq is hovering just above its 200-day moving average and with so much angst in the market, this line must hold. If it breaks, risk sentiment could unravel quickly, and we could see a retest of recent 2025 lows.
The trigger isn’t hard to find. Rising tensions in the Middle East are putting upward pressure on oil and energy. A sustained rally in crude would reignite inflation fears just as central banks begin easing. Powell was supposed to start cutting, but wars are always complicated.
Higher energy costs hit consumers, slow growth and force policymakers to rethink their next moves. That’s a headwind for tech and growth names.
Equities have enjoyed a solid run this year, pricing in a soft landing. But that assumption now feels shaky. Particularly for risky assets like the Nasdaq. The Dow might do better relative. The market isn’t just worried about geopolitics. It’s digesting the reality that inflation remains sticky. Bond yields are rising. Rate cuts are being pushed back. And oil isn’t helping.
If the Nasdaq holds its 200-day line, the bulls stay in control. But a break below will shift the momentum. That’s why this week matters.
We’re watching a simple but powerful signal. Stay above 20,500 and markets can stabilise. Break below, and volatility returns.
This trade is only for the brave. The story is shifting. Stay alert.
The forecasts provided herein are intended for informational purposes only and should not be construed as guarantees of future performance. This is an example only to enhance a consumer's understanding of the strategy being described above and is not to be taken as Blueberry Markets providing personal advice.

NASDAQ Breakout and Potential RetraceHey Traders, in tomorrow's trading session we are monitoring NAS100 for a selling opportunity around 21,700 zone, NASDAQ was trading in an uptrend and successfully managed to break it out. Currently is in a correction phase in which it is approaching the retrace area at 21,700 support and resistance zone.
Trade safe, Joe.

NASDAQ Pullback or Reversal? Watching 4H Support ZonePrice is reacting from the 1D resistance zone around 21,950 and now hovering near a 4H support zone at ~21,520.
• 1D Chart: Long wick rejection from resistance.
• 4H Chart: Break of rising wedge and rejection from 1H trendline.
• 1H & 23m Chart: Clear bearish order block formed. Price consolidating under broken structure.
Key Zones:
• Support: 21,500 / 21,325
• Resistance: 21,900 / 22,000
Bias: Bearish below 21,750. Retest of support expected.
NAS100\ Bullish Play DevelopingNasdaq holds a strong bullish structure on the 4H, so I moved down to the 15-minute for a cleaner bird’s-eye view of price action. Liquidity was swept directly into a refined order block — a precise tap that validated the zone.
Price is now hovering around a 5-minute OB. Just observing and letting the market unfold.
Discipline and patience — that’s where the edge is.
— Inducement King 👑
Bless Trading!

NAS100...Ever The Bullish Instrument (Part 40)Since creating the Lowest point of 2025 (monthly HL) on 4/6/2025 @7:10 pm...The low for the NAS100 has closed higher every single week for the past 10 weeks.
This week will not be any different as the market heads continues to head back to the ATH and beyond.
As you look at the charts...the blue lines are my weekly boundaries and the visual is using the H4 chart so as to show you the progression over the last 10 weeks...absolutely no LH to LL trends are seen as continuous.
Do not get fooled into thinking that this market is in a downtrend.
Any sells on the NAS100 are only temporary retracements in order the make the HL on the larger timeframe.
As always, I stand by my stance that the NAS100 will continue to make HL's to HH's guaranteed.
Have a great trading week...
#oneauberstrategy

Nasdaq is retracing from Triple TopNasdaq is retracing from Triple Top. Political situations in cities of US are furthur fueling this bearishness.

NASDAQ TRADING RESULT – JUNE 13, 2025📉 NASDAQ TRADING RESULT – JUNE 13, 2025 📉
Following the analysis from June 9, 2025, NASDAQ has reached the bearish target at Magnet Area (DmH4) 21524.00 on June 13, 2025.
The move started with a rejection from Magnet Area (SpH4) 21767.00 – 22067.00. As long as price remains below 21767.00, there is still downside potential toward Magnet Area (DmH4) 21136.00.
⚠️ DISCLAIMER:
This content is for educational purposes only and not financial advice. Trading involves high risk. Always perform your own analysis and apply proper risk management.

NASDAQ break and retest: SHORTI found a good and solid breakout of a TL and its retesting now.
The retest is now on the broken TL, strong area of S/R and its fibo level..
We will see further drop in next week!!
CHEERRRSSS...!!!

Lets retire on Trump bullmarketLets retire on Trump bullmarket, last time Trump delivered 120% Nasdaq gains over 4 years lets see history repeat itself!
Perfect buy point is now, block all bearish american pigs and retire now.

Bearish SignalPrice is currently at the highest resistance NAS100 ever reached in its lifetime and failed to break, the last time it tested the resistance it dropped dismally confirming it’s a very strong resistance. There’s also a dynamic resistance supported by the trend line in green which was a support zone prior. Im very confident the resistance won’t break, if it were to ever break it’ll need a strong pull back which will definitely suppress TP1

Venta en Nasdaq impulsada por volatilidad macroeconómicaThe Nasdaq presents a technical short opportunity following a strong reaction to volatility triggered by recent macroeconomic events. This pressure has activated a risk-off environment, with capital flowing out of tech assets into safe havens like the dollar or bonds.
The price is respecting a bearish structure on higher timeframes and, after a technical pullback into supply zones, rejection is confirmed with volume and reversal candlesticks. I expect bearish continuation as long as key levels remain intact and macro uncertainty persists.
📍 Trade based on price action and fundamental context.
⚠️ Risk is managed according to the trading plan, adjustable based on macro developments.

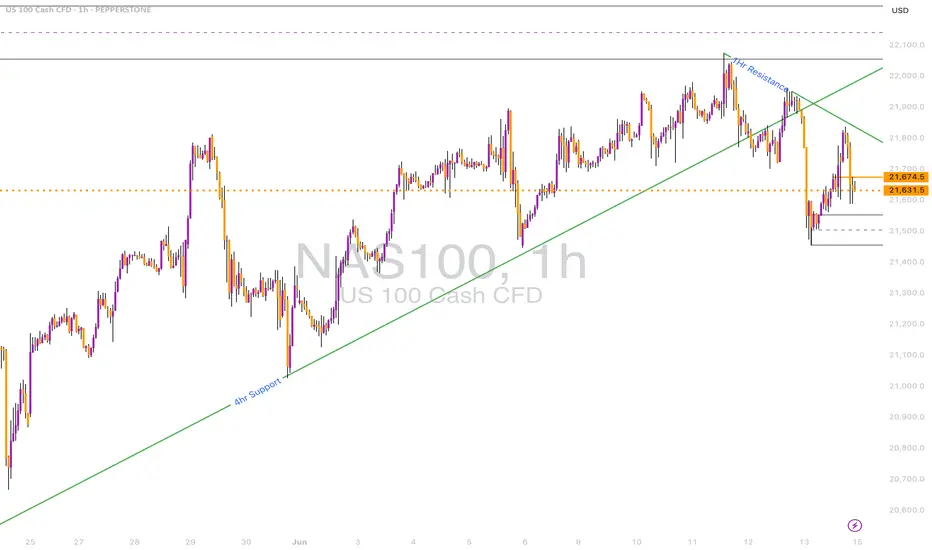
USNAS100 | Bearish Below 21635 Amid Geopolitical UncertaintyUSNAS100 | OVERVIEW
The index is currently under bearish momentum driven by escalating geopolitical tensions.
As long as the situation remains unresolved, downward pressure is expected to continue.
Outlook:
As long as the price stays below the pivot at 21635, the index is likely to drop toward 21470.
A confirmed break below 21470 could accelerate the decline toward 21250, and eventually 21065.
Pivot Line: 21635
Support Levels: 21470, 21250, 21065
Resistance Levels: 21790, 21930, 22090

NSDQ100 uptrend consolidation supported at 21300Markets Rattled After Israel Strikes Iran
Israel launched major airstrikes on Iran, targeting nuclear and missile sites, as well as top military leaders. The move sharply escalates tensions in the Middle East and came despite warnings from former President Donald Trump, who was told of the attack only shortly beforehand. He later warned Iran that future strikes would be “even more brutal” if no deal is made.
Market Reaction:
Oil jumped up to 13% on fears of supply disruptions.
Gold climbed as investors rushed to safe-haven assets.
Stock futures and crypto fell on rising geopolitical risk.
The U.S. dollar dipped, then rebounded, as its role as a safe-haven asset came into focus.
Other Key Updates:
Trump wins court backing to keep troops in Los Angeles amid ongoing protests. A hearing is set for Tuesday.
Meta invests billions in Scale AI, bringing on its CEO to boost efforts in building artificial general intelligence. Meta is aggressively hiring top AI talent from firms like Google.
For Traders:
Watch oil and gold closely for continued volatility.
Safe-haven flows could drive further USD and gold moves.
Meta’s AI push may influence tech sector sentiment.
Key Support and Resistance Levels
Resistance Level 1: 22070
Resistance Level 2: 22370
Resistance Level 3: 22680
Support Level 1: 21300
Support Level 2: 21060
Support Level 3: 20820
This communication is for informational purposes only and should not be viewed as any form of recommendation as to a particular course of action or as investment advice. It is not intended as an offer or solicitation for the purchase or sale of any financial instrument or as an official confirmation of any transaction. Opinions, estimates and assumptions expressed herein are made as of the date of this communication and are subject to change without notice. This communication has been prepared based upon information, including market prices, data and other information, believed to be reliable; however, Trade Nation does not warrant its completeness or accuracy. All market prices and market data contained in or attached to this communication are indicative and subject to change without notice.

NASDAQ The bearish bias is supported by the COT data showing the majority of non-commercial traders are increasing their short positions. Sell/Short: Consider entering a short position at current levels, with a stop above the resistance zone (preferably just above the recent swing high).

Nasdaq-100 H1 | Swing-low support at 61.8% Fibonacci retracementThe Nasdaq-100 (NAS100) is falling towards a swing-low support and could potentially bounce off this level to climb higher.
Buy entry is at 21,479.25 which is a swing-low support that aligns closely with the 61.8% Fibonacci retracement.
Stop loss is at 21,320.00 which is a level that lies underneath a pullback support.
Take profit is at 21,721.90 which is a pullback resistance that aligns with the 50% Fibonacci retracement.
High Risk Investment Warning
Trading Forex/CFDs on margin carries a high level of risk and may not be suitable for all investors. Leverage can work against you.
Stratos Markets Limited (tradu.com ):
CFDs are complex instruments and come with a high risk of losing money rapidly due to leverage. 63% of retail investor accounts lose money when trading CFDs with this provider. You should consider whether you understand how CFDs work and whether you can afford to take the high risk of losing your money.
Stratos Europe Ltd (tradu.com ):
CFDs are complex instruments and come with a high risk of losing money rapidly due to leverage. 63% of retail investor accounts lose money when trading CFDs with this provider. You should consider whether you understand how CFDs work and whether you can afford to take the high risk of losing your money.
Stratos Global LLC (tradu.com ):
Losses can exceed deposits.
Please be advised that the information presented on TradingView is provided to Tradu (‘Company’, ‘we’) by a third-party provider (‘TFA Global Pte Ltd’). Please be reminded that you are solely responsible for the trading decisions on your account. There is a very high degree of risk involved in trading. Any information and/or content is intended entirely for research, educational and informational purposes only and does not constitute investment or consultation advice or investment strategy. The information is not tailored to the investment needs of any specific person and therefore does not involve a consideration of any of the investment objectives, financial situation or needs of any viewer that may receive it. Kindly also note that past performance is not a reliable indicator of future results. Actual results may differ materially from those anticipated in forward-looking or past performance statements. We assume no liability as to the accuracy or completeness of any of the information and/or content provided herein and the Company cannot be held responsible for any omission, mistake nor for any loss or damage including without limitation to any loss of profit which may arise from reliance on any information supplied by TFA Global Pte Ltd.
The speaker(s) is neither an employee, agent nor representative of Tradu and is therefore acting independently. The opinions given are their own, constitute general market commentary, and do not constitute the opinion or advice of Tradu or any form of personal or investment advice. Tradu neither endorses nor guarantees offerings of third-party speakers, nor is Tradu responsible for the content, veracity or opinions of third-party speakers, presenters or participants.

NAS - LOOKING FOR RECOVERTeam This morning we got out of beautiful SHORT on UK100
Market dumping hard due to ISRAEL'S and Iran
However we expect market to be recover during UK market opening
Please follow the price accordingly to the chart
Once it reach 1st target, take 50-70% profit reduce the volume and bring stop loss to BE
LET'S GO.

USTECPrevious analysis on May 30 found that the price came down to test the support level at 20,693 but could not break through. Now the price has returned to test the resistance level at 21,737-22,139 again. If the price cannot break through the level of 22,139, it is expected that the price will drop. Consider selling in the red zone.
🔥Trading futures, forex, CFDs and stocks carries a risk of loss.
Please consider carefully whether such trading is suitable for you.
>>GooD Luck 😊
❤️ Like and subscribe to never miss a new idea!

NDX CRACK!I will keep this simple.
The rising wedge broke. Markets are in trouble.
The Trump disaster keeps escalating every day.
This is what the world looks like without the US
strong leadership defending freedom and democracy. CHAOS!

#NASDAQ (4H)"NASDAQ futures (4H) will dropped from 21,938.3 to 21,562.0 — one of the key indicators from the specified zone."
First Target Zone 19,245 To 18,842

ICT cheat code 15 minutes strategy using frankfort timeThis is the guideline on how to use the strategy
1.Identify accunilation ,minipulation
2.Use 06:00 to 07:00 for entry point
3.Identify either a ifvg or fvg
4.Enter at the specific time stated.
5.Target 2 takeprofits 200 pips and 300 pips
Use as stated ill be active and post at those times to show prove of strategy

SNIPER Smart money NASDAQ
🟢 Smart Money Sniper Analysis – NASDAQ (US100) H4
✒️ By Talion-Promosale
📅 June 12, 2025
🔹 Current Price: 21,867
🔹 RSI(14): 52.49 (neutral to slightly bullish momentum)
🔹 Market Structure: Bullish – price forming higher lows above key EMAs
🔹 Price is above the 200 EMA (white), and testing the 50 EMA (red)
🔹 Smart Money Zone: Last bullish order block between 21,700 – 21,740
---
🎯 Trading Signal – BUY (Smart Money Sniper Setup)
Sniper Entry Zone: 21,700 – 21,740 (Bullish Order Block + dynamic EMA support)
Confirmation Entry: Above 21,870
Take Profit 1 (TP1): 22,000
Take Profit 2 (TP2): 22,150
Stop Loss (SL): 21,620
💡 Context:
Price action remains bullish, supported by the 200 EMA and a clean rejection near the 50 EMA. RSI is above 50, indicating potential for upward continuation. The Smart Money zone between 21,700 and 21,740 serves as an ideal sniper re-entry area.
If price re-tests this order block with bullish rejection candles, it presents a high-probability buy opportunity. A break and close above 21,870 confirms momentum toward 22,000 and higher.
---
⛔ Invalidation:
A strong bearish close below 21,620 on the H4 chart would invalidate the bullish scenario.

Bearish reversal off pullback resistance?USTEC is rising toward the pivot, which serves as a pullback resistance. A reversal from this level could indicate a double top pattern, potentially leading to a price drop to the 1st support.
Pivot: 22,270.83
1st Support: 21,142.23
1st Resistance: 23,070.85
Risk Warning:
Trading Forex and CFDs carries a high level of risk to your capital and you should only trade with money you can afford to lose. Trading Forex and CFDs may not be suitable for all investors, so please ensure that you fully understand the risks involved and seek independent advice if necessary.
Disclaimer:
The above opinions given constitute general market commentary, and do not constitute the opinion or advice of IC Markets or any form of personal or investment advice.
Any opinions, news, research, analyses, prices, other information, or links to third-party sites contained on this website are provided on an "as-is" basis, are intended only to be informative, is not an advice nor a recommendation, nor research, or a record of our trading prices, or an offer of, or solicitation for a transaction in any financial instrument and thus should not be treated as such. The information provided does not involve any specific investment objectives, financial situation and needs of any specific person who may receive it. Please be aware, that past performance is not a reliable indicator of future performance and/or results. Past Performance or Forward-looking scenarios based upon the reasonable beliefs of the third-party provider are not a guarantee of future performance. Actual results may differ materially from those anticipated in forward-looking or past performance statements. IC Markets makes no representation or warranty and assumes no liability as to the accuracy or completeness of the information provided, nor any loss arising from any investment based on a recommendation, forecast or any information supplied by any third-party.
