Related indices
Tracking the correlation/decoupling of BTC & tech stocks🚨🌊🔜👀This idea seems to be continuing on pretty well, showing the "slow" decoupling of BTC and the stock market. Currently the trend has been broken and there seems to be a confirmed retest of the upper trend. A good bounce off this should see the ratio move towards the 0.29 level and a break of that res
US Tech Index vs. BitcoinBy charting the growth rates of both the NASDAQ US TECH 100 and Bitcoin, it clearly shows a recent decline against BTC. This decline may also show the recent correlation Bitcoin has had with the NASDAQ, as the closer it gets to 0, the more correlated they are. It has broken an important trend, which
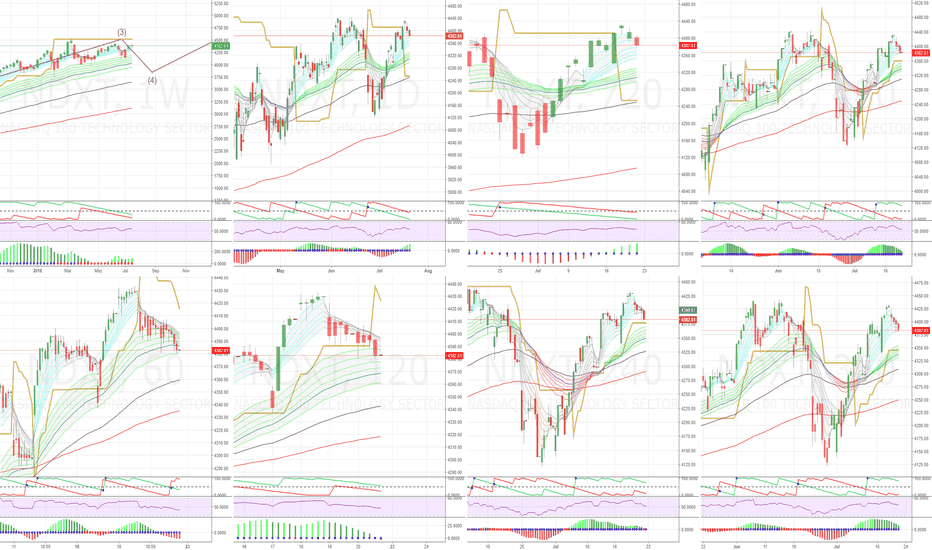
NASDAQ Tech Stocks Tech stocks have taken a hit after a major run up and earnings releases.
As we approach the 200D MA it's a key indicator historically of big price movement. What does this mean for us?
We'll likely see a big dip in tech stocks whereby they correct in order to give way to another price run up.
These
The Tech Sector is Due for a CorrectionAfter explosive growth over the last few years, I think the time has finally come for a larger correction.
Here is why I think so:
1. The main bullish channel has been broken with the selloff that occurred early October and hasn't been able to break through the short term resistance for recovery.
NASDAQ 100 TechI'm using this mainly to see how it influences other stock markets.
I've entered a small position size short on this based partly on experience on the 1H time frame. But that's not where the main action is.
This market tends to influence events in the Indian and Japanese stock markets.
See all ideas
Displays a symbol's price movements over previous years to identify recurring trends.


