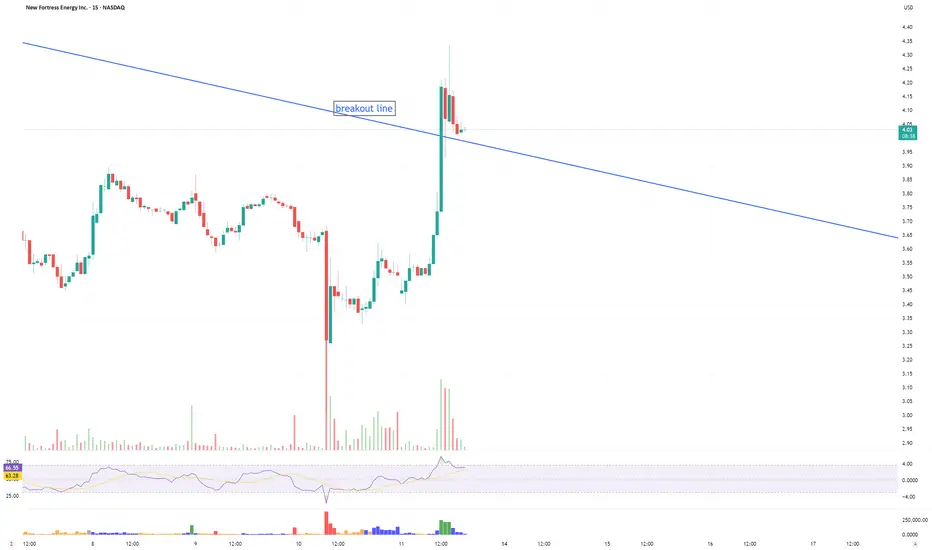
$NFE will Fast LNG have a breakout?Corruption and little fiefdoms plague NFE's progress in Puerto Rico. Even with a great bounce today, NFE needs to hold above this 'breakout line' to have a chance to regain its former shareholder glory. Will it do so? Will the CEO ever grab a gain when he bought at $8.77?
Next report date
—
Report period
—
EPS estimate
—
Revenue estimate
—
−2.24 USD
−249.04 M USD
2.36 B USD
178.62 M
About New Fortress Energy Inc.
Sector
Industry
CEO
Wesley Robert Edens
Website
Headquarters
New York
Founded
2014
FIGI
BBG00MJH9LC4
New Fortress Energy, Inc. is a holding company engaged in the management of integrated gas-to-power energy infrastructure. It funds, builds, and operates natural gas infrastructure and logistics to deliver energy solutions. The company was founded by Wesley Robert Edens on February 25, 2014 and is headquartered in New York, NY.
Related stocks
NFE | Long-Term Falling Wedge Reversal – 10X Over 39 months📍 Ticker: NASDAQ:NFE (New Fortress Energy Inc.)
📆 Timeframe: 1W (Weekly)
📉 Price: $3.34
📊 Volume: 829K
📈 Time Horizon: 39 months (~Q4 2028)
🔍 Technical Setup:
NASDAQ:NFE has formed a classic falling wedge over multiple quarters and is now attempting a long-term reversal from a compressed base.

Safe Entry ZoneStock heading South after recent up movement now stocks may Re-Test the green zone 1h.
and always Wait for buy signal after confirmation.
Note: "buy signal after confirmation" Means that:
We have two scenarios must happen at The Mentioned Zone:
Scenarios One: strong buying volume with reversal C

NFE: Bullish Breakout Setup Above $14.53!NFE is displaying a potential breakout setup with an entry point at $14.53. Here are the trade parameters:
- **Entry:** $14.53 (yellow line, breakout level).
- **Stop Loss (SL):** $13.97 (below support zone).
- **Take Profit Targets:**
- **Target 1 (T1):** $15.14 (first resistance level).

NFE DOUBLE WHAMMY BULLISH.NFE has completed a multiyear correction imo, ending with 2 bullish harmonic patterns. the 1st and largest is a bullish bat pattern with a high probability (70-80%) of bouncing at the .886 fib level. The second is a bullish crab pattern with a high probability (80-90%) of bouncing at the 1.618 exten


NFE to break higher?New Fortress Energy Inc - 30d expiry - We look to Buy a break of 31.71 (stop at 28.81)
We are trading at oversold extremes.
Posted a Double Top formation.
A break of the recent high at 31.58 should result in a further move higher.
31.58 has been pivotal.
Although the bears are in control, the

NFE to break higher? New Fortress Energy Inc - 30d expiry - We look to Buy a break of 31.71 (stop at 28.81)
We are trading at oversold extremes.
Posted a Double Top formation.
A break of the recent high at 31.58 should result in a further move higher.
31.58 has been pivotal.
Although the bears are in control, the

NFE to turnaround?New Fortress Energy Inc - 30d expiry - We look to Buy a break of 31.71 (stop at 28.81)
We are trading at oversold extremes.
Bullish divergence is expected to support prices.
A break of the recent high at 31.58 should result in a further move higher.
31.58 has been pivotal.
Although the bears a

April Gainers (NFE, account up 0.5%)1st gainer in April is NASDAQ:NFE .
Holding period is 12 days (3/22/23-4/3/23).
Account is up 0.5%.
Total return in April is 0.5%

See all ideas
Summarizing what the indicators are suggesting.
Neutral
SellBuy
Strong sellStrong buy
Strong sellSellNeutralBuyStrong buy
Neutral
SellBuy
Strong sellStrong buy
Strong sellSellNeutralBuyStrong buy
Neutral
SellBuy
Strong sellStrong buy
Strong sellSellNeutralBuyStrong buy
An aggregate view of professional's ratings.
Neutral
SellBuy
Strong sellStrong buy
Strong sellSellNeutralBuyStrong buy
Neutral
SellBuy
Strong sellStrong buy
Strong sellSellNeutralBuyStrong buy
Neutral
SellBuy
Strong sellStrong buy
Strong sellSellNeutralBuyStrong buy
Displays a symbol's price movements over previous years to identify recurring trends.
NFE5767340
New Fortress Energy Inc. 8.75% 15-MAR-2029Yield to maturity
137.13%
Maturity date
Mar 15, 2029
See all NFE bonds
Frequently Asked Questions
The current price of NFE is 3.27 USD — it has increased by 9.36% in the past 24 hours. Watch New Fortress Energy Inc. stock price performance more closely on the chart.
Depending on the exchange, the stock ticker may vary. For instance, on NASDAQ exchange New Fortress Energy Inc. stocks are traded under the ticker NFE.
NFE stock has fallen by −15.50% compared to the previous week, the month change is a −14.40% fall, over the last year New Fortress Energy Inc. has showed a −79.71% decrease.
We've gathered analysts' opinions on New Fortress Energy Inc. future price: according to them, NFE price has a max estimate of 8.50 USD and a min estimate of 2.00 USD. Watch NFE chart and read a more detailed New Fortress Energy Inc. stock forecast: see what analysts think of New Fortress Energy Inc. and suggest that you do with its stocks.
NFE stock is 17.67% volatile and has beta coefficient of 1.94. Track New Fortress Energy Inc. stock price on the chart and check out the list of the most volatile stocks — is New Fortress Energy Inc. there?
Today New Fortress Energy Inc. has the market capitalization of 819.85 M, it has increased by 13.92% over the last week.
Yes, you can track New Fortress Energy Inc. financials in yearly and quarterly reports right on TradingView.
New Fortress Energy Inc. is going to release the next earnings report on Aug 6, 2025. Keep track of upcoming events with our Earnings Calendar.
NFE earnings for the last quarter are −0.73 USD per share, whereas the estimation was −0.25 USD resulting in a −194.32% surprise. The estimated earnings for the next quarter are −0.60 USD per share. See more details about New Fortress Energy Inc. earnings.
New Fortress Energy Inc. revenue for the last quarter amounts to 384.88 M USD, despite the estimated figure of 575.28 M USD. In the next quarter, revenue is expected to reach 444.92 M USD.
NFE net income for the last quarter is −199.58 M USD, while the quarter before that showed −223.56 M USD of net income which accounts for 10.73% change. Track more New Fortress Energy Inc. financial stats to get the full picture.
Yes, NFE dividends are paid quarterly. The last dividend per share was 0.10 USD. As of today, Dividend Yield (TTM)% is 13.38%. Tracking New Fortress Energy Inc. dividends might help you take more informed decisions.
As of Aug 6, 2025, the company has 1.4 K employees. See our rating of the largest employees — is New Fortress Energy Inc. on this list?
EBITDA measures a company's operating performance, its growth signifies an improvement in the efficiency of a company. New Fortress Energy Inc. EBITDA is 550.53 M USD, and current EBITDA margin is 34.15%. See more stats in New Fortress Energy Inc. financial statements.
Like other stocks, NFE shares are traded on stock exchanges, e.g. Nasdaq, Nyse, Euronext, and the easiest way to buy them is through an online stock broker. To do this, you need to open an account and follow a broker's procedures, then start trading. You can trade New Fortress Energy Inc. stock right from TradingView charts — choose your broker and connect to your account.
Investing in stocks requires a comprehensive research: you should carefully study all the available data, e.g. company's financials, related news, and its technical analysis. So New Fortress Energy Inc. technincal analysis shows the sell today, and its 1 week rating is sell. Since market conditions are prone to changes, it's worth looking a bit further into the future — according to the 1 month rating New Fortress Energy Inc. stock shows the sell signal. See more of New Fortress Energy Inc. technicals for a more comprehensive analysis.
If you're still not sure, try looking for inspiration in our curated watchlists.
If you're still not sure, try looking for inspiration in our curated watchlists.