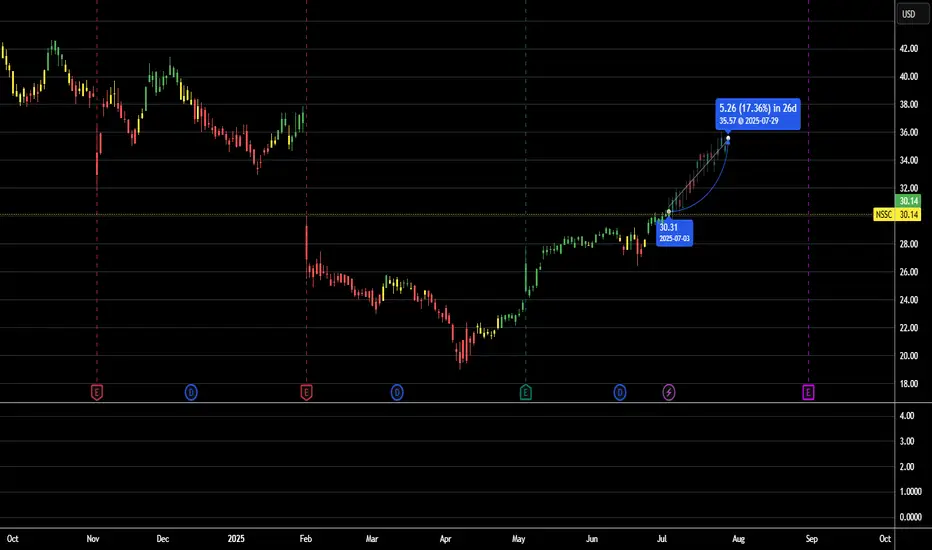
Trade Plan (Short-Term Swing) for $NSSC🔍 Chart Setup & Trend
Timeframe: Daily chart
Trend: NASDAQ:NSSC has recently rebounded from support around $28 and is attempting a short-term recovery after a corrective phase.
The price is back above the 20-day EMA, signaling renewed buying interest.
A move above $31.00–$31.50 resistance could trigger a bullish breakout.
📊 Key Technical Indicators
RSI: ~54
↳ Neutral zone, with room to move toward overbought territory.
MACD: Bullish crossover is forming
↳ Indicates upside momentum building.
Volume: Increasing volume on green days—suggests accumulation phase.
🔧 Support & Resistance
Support: $28.50 (recent bounce zone)
Resistance 1: $31.00 (near-term ceiling)
Resistance 2: $33.50
17% Price Target: $35.26
🎯 Trade Plan (Short-Term Swing)
Entry: $30.14 (or breakout confirmation above $31.00)
Target (17% gain): $35.26
Stop-loss: $28.40 (below recent swing low and EMA support)
Risk/Reward Ratio: ~1:2.2
📈 Example Calculation
Entry: $30.14
Target: $35.26
Stop-loss: $28.40
Potential Gain: $5.12
Potential Loss: $1.74
⚠️ Risks
If $31.00 fails to break, the stock could range or retest lower support.
Broader tech/security sector weakness could drag NASDAQ:NSSC even if setup looks bullish.
Keep an eye on earnings dates or macroeconomic risk (interest rates, spending cuts, etc.).
✅ Summary
Napco Security Technologies ( NASDAQ:NSSC ) shows early signs of a trend reversal. With momentum building above key short-term moving averages, a 17% move to $35.26 is feasible if the stock breaks through $31 with strength.
Entry: ~$30.14
Target: $35.26
Stop-loss: ~$28.40
Outlook: Cautiously Bullish, confirmation above $31 preferred.
NSSC trade ideas
Room for growth with NAPCOA quick look at the chart shows that NAPCO has quite a bit of room for possible growth. There is a strong uptrend that doesn’t seem to be slowing down at this time.
I am going to be watching to see if it stays above that $20 level ideally and continue its trend upwards.
This company provides vital equipment for burglar alarm and fire alarm communications. As well as other equipment.
Without their communicators, many buildings would have no communication to local fire and police departments. That being said I believe NAPCO will be sticking around. I believe there is a large upside potential here.
NFA, just sharing my thoughts

NSSC Swing tradeDetails in screenshot. Aside from the technicals listed it is likely playing off the overreaction from an earnings report. We stopped directly at the golden channel. It's a large swing trade so remember to use properly risk management. You don't want to risk losing 10% of your portfolio in one trade.
Protect your money.

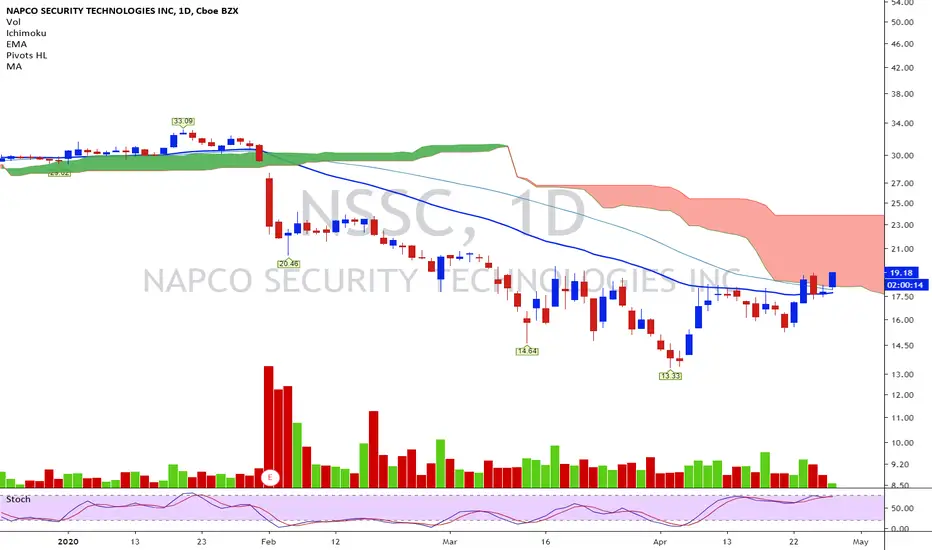
NSSC looks promising after a 55 Moving Average bounce5 reasons why NAPCO Security Technologies looks promising
#1 - Price has just retested the 55 Exponential Moving Average, a key ema here
#2 - Price candlesticks show the bounce and subsequent break past 3 key Exponential Moving Averages;
8 ema ( green), 21 ema (yellow crosses), 34 ema (orange)
#3 - Volume levels indicate a nice uptick in volume over the past 5 days
#4 - 2 key sentiment indicators; Stochastic and the RSI Indicator strongly suggest bullish
movement upwards
#5 - We have a GREEN STACKED WEEKLY EMA condition, and a YELLOW stacked daily ema condition (could turn green shortly);
EMAs are natural price resistances for the stock price. However, the stock price is ABOVE these resistance levels,
allowing price to trend toward prior price targets and not being hampered by emas holding it back
In addition to these favorable conditions, Friday's candlestick alone is very bullish.
Institutional ownership is at a whopping 77%! As a result, a sizeable amount of institutional money invested in a firm is generally viewed as a positive attribute.
As traders, the best we can do is to do our due diligence, pull the trigger on something that makes sense.
*Let's see what happens*
DISCLAIMER - I am not a professional trader. These are merely my thoughts and possible moves; i enjoy watching these stocks validate my process or slap me across the face lol. If you are in need of professional assistance with your trades, don't look here. I am not that guy.

Strong Stock, Weak GroupThis thing just won't go away. Consistent and orderly support. Fast-moving potential.
Company Fundamentals
EPS Due Date2/8/2022
EPS % Chg (Last Qtr)62%
3 Year EPS Growth Rate12%
EPS Est % Chg (Current Yr)51%
Annual ROE17.4%
Sales % Chg (Last Qtr)34%
3-Year Sales Growth Rate5%
Debt %2%
Market Cap
$917 Mil
Annual Pre -Tax Margin15.2%
SectorBusins Svc
Industry GroupSecurity/Sfty
Industry Group Rank165

NSSC nice setupTrading above 8 and 50 MAs. Potential to hit $22-$25 once it breaks out and stays above 19.75
NSSC, Beau M chartiste !Un M parmis les plus fort ( 80% ). Ont doit juste attendre la confirmation en 4H des moyennes mobiles .

NSSC Announces Continuation of Stock Repurchase Plan NSSC: NAPCO Security Technologies, Inc.
2018-09-13 08:00:00
NAPCO Security Technologies Announces Continuation of Stock Repurchase Plan

