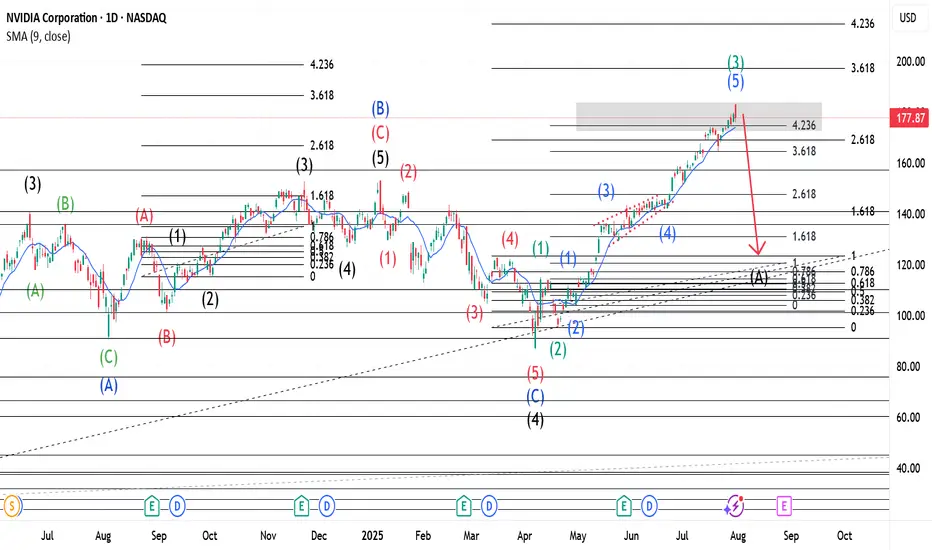
$NVDA: Cycle-Wired Levels🏛️ Research Notes
The fact that the angle of linear connection between 3rd degree points (fractal hierarchy) acted multiple amout of times as support and eventually resistance from which tariff drop happened establishing bottom and expanding from there.
That means if we were to justify the texture of ongoing wave from that bottom, we would geometrically quantify the area of that triangle to project considering historic data to remain objective approach (and NOT what levels we subjectively want to see whether we are bullish or bearish). There is mean reversion rule also going on which will be structurally addressed.
No matter where your actual target is at, there are always structural boundaries that price must break through first in order to get there. And because markets tend to move in proportion to their own scale — often aligning with exponents of the golden ratio, we treat phi as a constant within this probabilistic space.
NVDA trade ideas

NVDA Bullish Weekly Trade Setup** – 2025-07-29
📈 **NVDA Bullish Weekly Trade Setup** – 2025-07-29
🚀 *"Momentum meets money flow!"*
### 🔍 Market Snapshot:
* 💥 **Call/Put Ratio**: 2.47 → Bullish sentiment confirmed
* 🧠 **RSI**: Rising on Daily & Weekly → Momentum building
* 🔕 **Low VIX**: Favors call strategies (cheap premiums)
* ⚠️ **Caution**: Light volume = soft institutional backing
---
### 🔧 Recommended Options Trade:
**🟢 NVDA \$182.50 CALL (Exp: Aug 1)**
💰 *Entry*: \~\$0.53 (Mid)
📈 *Profit Target*: \$0.69 – \$1.06
🛑 *Stop Loss*: \$0.32
📆 *DTE*: 3 days
🔄 *Entry Timing*: Market Open
✅ *Confidence*: 75%
🔥 *Theta & Gamma Risk*: Elevated — manage position size!
---
### 💡 Why This Trade?
✅ RSI Strength across timeframes
✅ Flow favors upside
✅ Cheap premium in a low-volatility regime
🟡 Just watch that volume…
---
📊 **TRADE SNAPSHOT (JSON):**
```json
{
"instrument": "NVDA",
"direction": "call",
"strike": 182.50,
"expiry": "2025-08-01",
"confidence": 0.75,
"profit_target": 1.06,
"stop_loss": 0.32,
"size": 10,
"entry_price": 0.53,
"entry_timing": "open",
"signal_publish_time": "2025-07-29 11:59:10 UTC-04:00"
}
```
---
📣 **Taglines for Sharing:**
* "NVDA setup is 🔥—momentum + flow = GO!"
* "Gamma risk is real—but so is this profit window 💸"
* "Short-term sprint or fade? This call has range."

Nvidia Just Under Major SupportNvidia seems to have been pulled down by the Dow just like Apple as both are just under major support. I'm sorry for my previous Nvidia chart that drew support near 140, I recognize where I screwed up, but this chart should be good. Fortunately actual 117 support wasn't that far below and my NVDA isn't too in the red.
NVDA has the lowest revenue multiple in years right now. I know it's well off it's long term trend line, but it's growth rate is unlike anything it's ever been so expecting a steeper trend line to appear makes a lot of sense. Eventually I would imagine we'll get back to that trend line, but not anytime soon.
The Dow hitting major support should finally lift NVDA and the others that have been dragged down like AAPL and AMZN.
Good luck!

NVDA: Last week of July Just my thoughts on NVDA.
Not advice of course.
As always, trade safe and have a great weekend!

99% of people buying $NVDA don't understand this:🚨99% of people buying NASDAQ:NVDA don't understand this:
NASDAQ:GOOGL : “We’re boosting AI capex by $10B.”
Wall Street: “Cool, that’s like $1B or 0.06 per share for $NVDA.”
So from $170.50 at the time of news to $170.56 right?
No.
NASDAQ:NVDA trades at 98× earnings. So that $0.06? Turns into $6.00
Why?
Because people are expecting that to be happening every single year for 98 years and they're paying All of it Today in Full amount.
So NASDAQ:NVDA will get $1B more per year. But NASDAQ:NVDA price per share already increased by $100B in past 2 days 😂
Then it crashes 40% and everyone is wondering why.

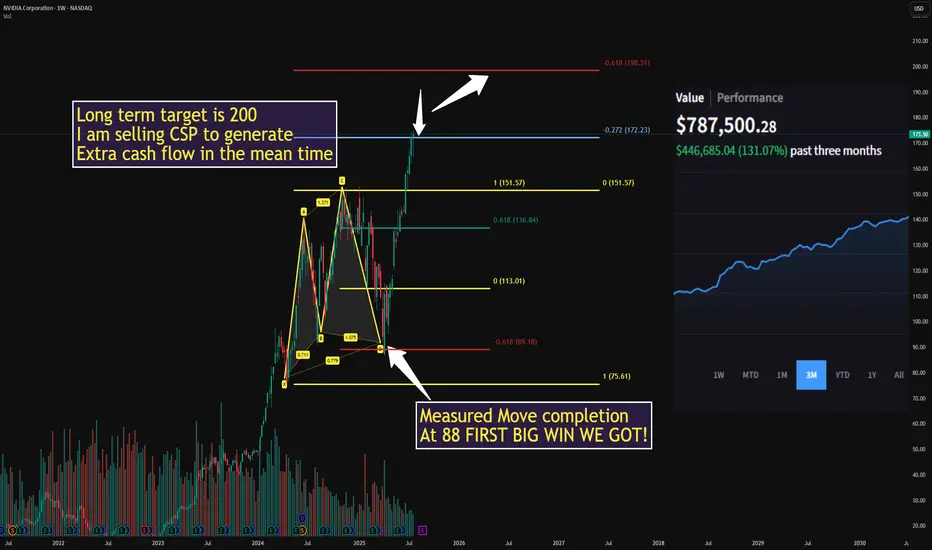
$NVDA ONCE IN A LIFETIME from 88 to 174 BOOM!WE crushed it using the 618 measured move from 88 to 174 in April
Next target is 200 and I am waiting for a decent pull back
In the mean time I will sell puts to generate cash flow, I will alert my next buy here
NO CHARGE all I ask is drop a LIKE
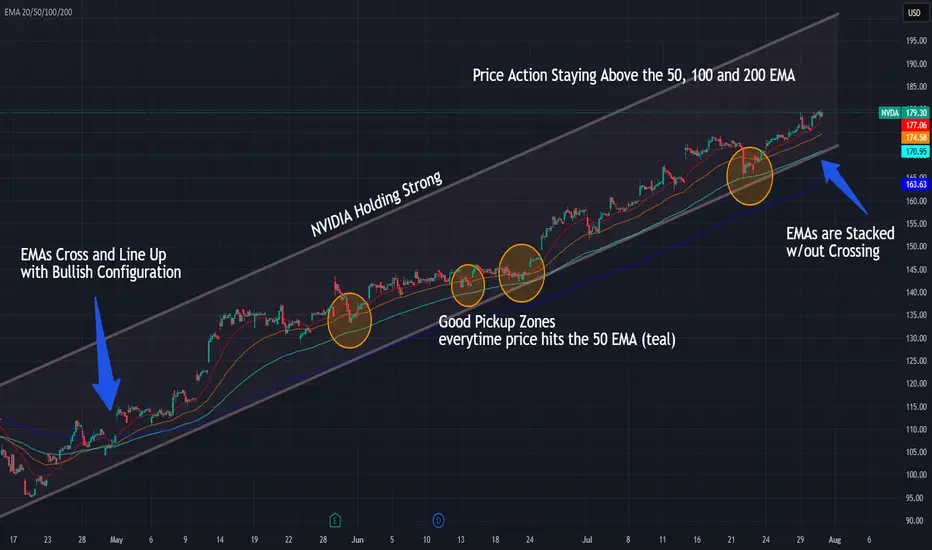
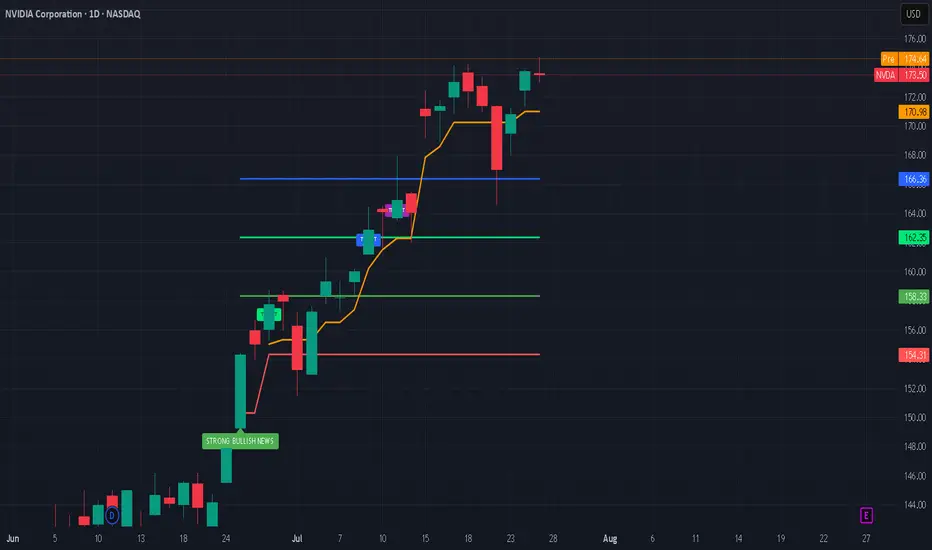
NVIDIA Riding the 50 EMA — Trend Still IntactNVDA continues to respect the rising channel while price holds above the 50, 100, and 200 EMAs — with each 50 EMA touch offering solid entries.
📌 Bullish EMA structure: 20/50/100/200 stacked clean
📌 50 EMA = key support and entry zone
⏱️ Timeframe: 1H
#nvda #stocks #ema #swingtrading #bullishtrend #quanttradingpro #tradingview
NVDA-the AI TitanNVIDIA (NVDA) continues to dominate the AI semiconductor space and remains one of the strongest momentum names in the market. After reaching new highs, price action is now offering a clean multi-tiered entry opportunity for swing traders positioning for the next leg up.
Entry Points
✅ $160 – Breakout retest zone
✅ $145 – Key technical support
✅ $130 – Strong demand zone from prior consolidation
Profit Targets
📈 TP1: $180
🚀 TP2: $190
💰 TP3: $200+
📌 Disclaimer: This is not financial advice. Just sharing my view and trade idea. Always do your own research and manage risk accordingly.

Elliott Waves indicate a possible correction.We may be at a peak, and a correction within the second wave could be approaching. This is suggested by Elliott Wave theory, as well as divergence on indicators and technical analysis patterns.

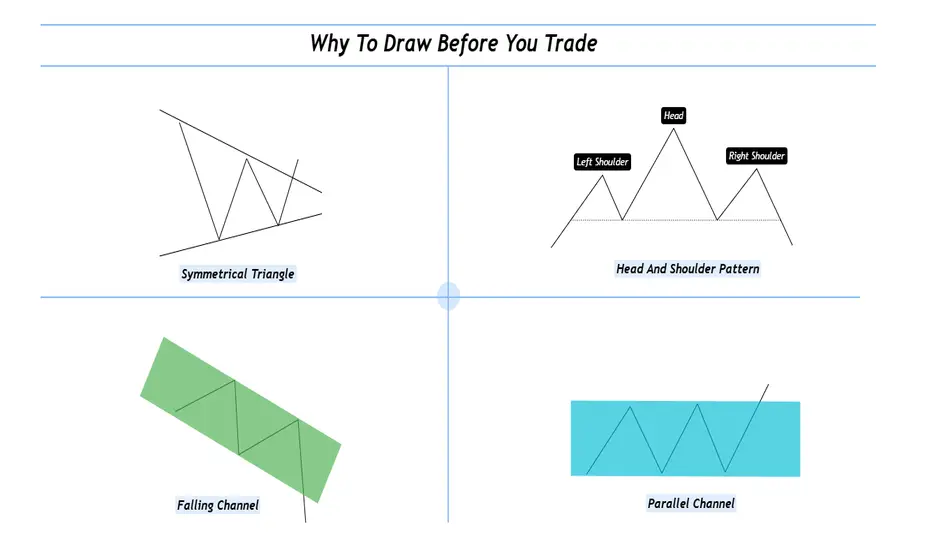
Why To Draw Before You Trade ?Hello fellow traders and respected members of the trading community, In a fast paced market dominated by automation and algorithms, we often forget the value of simply picking up a tool and drawing on our charts. Let’s revisit why this fundamental habit still holds the power to sharpen our edge and elevate our decision-making.
Why We Should Draw and Trade? Turning Charts Into Clarity
Introduction-:
In an age of auto-generated indicators, black-box algorithms, and AI-driven signals, many traders are drifting away from one of the most fundamental trading tools: manual chart drawing.
But what if the very act of drawing is not just an old habit—but a powerful trading edge?
This publication explores why actively drawing on charts and trading based on visual context can elevate your market understanding and execution like nothing else.
1. What Does It Mean to “Draw and Trade? Drawing isn’t just technical analysis it’s interactive thinking. When you draw, you're mapping the structure of the market using tools like
Trendlines
Support & Resistance zones
Chart Patterns (Head & Shoulders, Flags, Triangles, etc.)
Supply & Demand levels
Gaps, Fibonacci levels, and more
Once the chart is marked, you’re no longer entering trades blindly you’re entering with context, clarity, and confidence.
2. The Psychology Behind Drawing
Manual drawing engages your focus, discipline, and decision-making. You don’t just predict, you process and It forces you to slow down helping reduce impulsive trades. Drawing anchors your emotions and keeps you mindful. The act of drawing becomes a psychological filter—helping you trade from structure, not stress.
3. Why It Beats Indicator Only Trading?
Indicators are reactive. Drawing is proactive.
Here’s the difference:
Indicators show what already happened
Drawing lets you prepare for what could happen
You learn to-:
Anticipate breakouts, fakeouts, and reversals, Understand market structure and Develop your own strategy not depend on someone else's signal. In short you become the strategist, not just a follower.
4. The “Chart Time” Advantage
Just like pilots need flight hours, traders need chart hours. Drawing charts manually gives you those hours.
You start to see patterns that repeat and notice behavior shifts before they show on indicators. Build a visual memory of how the market moves and It’s this visual experience that separates analysts from traders.
5. Real-World Edge: Case Studies
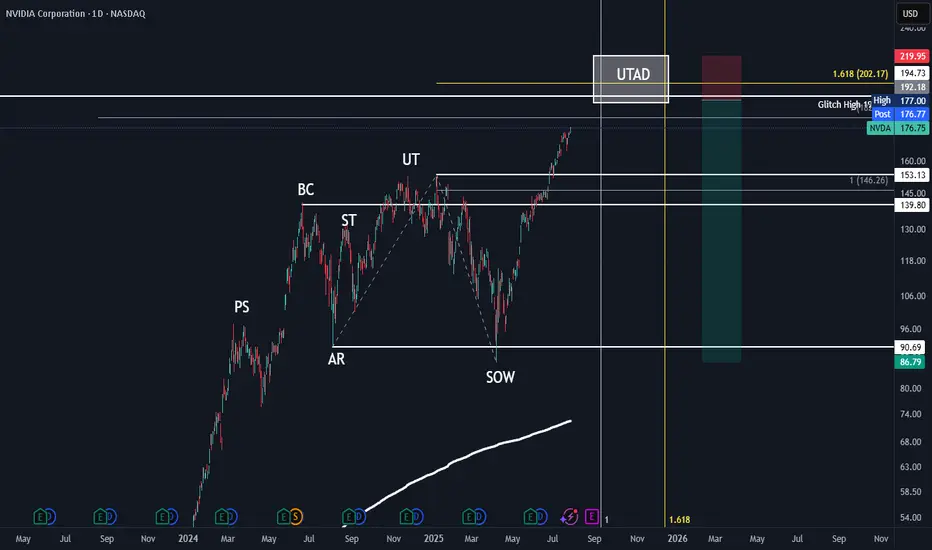
Wyckoff Distribution: Mapping the structure—BC, AR, ST, UT, LPSY—helps anticipate smart money exits.
Gap Zones: Marking an old breakaway gap can help predict future rejection or support
Demand Zones + Fib Confluence: Drawing reveals high-probability reversal zones most indicators miss
Each drawing becomes a trade-ready story with logic and risk control.
6. From Drawing to Discipline
Drawing is not just prep it’s planning. You trade with a clear plan and pre-identified entry/exit zones this reduced emotional interference and It becomes your personal visual rulebook. No noise no randomness just structure driven action.
7. Final Thoughts: The Trader’s Mind vs. The Machine
Yes, AI and indicators are useful.
But your most powerful edge?
Your mind.
Your eyes.
Your experience sharpened through drawing.
If you want to evolve from a reactive trader to a consistent performer, here’s the golden rule:
Stop watching. Start drawing. Trade what you see, not what you hope.
I hope you will like this post, Thanks for giving your valuable time for reading.
Regards- Amit
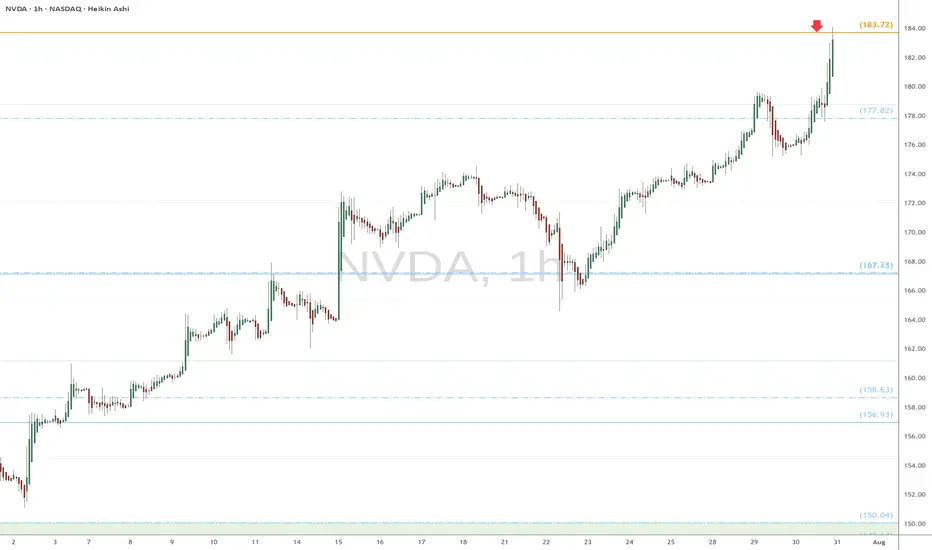
NVDA heads up at $183.72: Golden Genesis fib to mark a TOP?Chips have been flying high since the April lows.
NVDA has just hit a Golden Genesis fib at $183.72
This is a "very high gravity" fib so expect a reaction.
It is PROBABLE that we "orbit" this fib a few times.
It is POSSIBLE that we reject to form a major top.
It is PLAUSIBLE that we Break-n -Retest to continue.\
.
See "Related Publications" for previous EXACT plots ------>>>>>>>>
Such as this post at the last Golden Genesis:
Hit the BOOST and FOLLOW for more such PRECISE and TIMELY charts
============================================================
.
Nvidia - This is clearly not the end!📐Nvidia ( NASDAQ:NVDA ) will confirm the breakout:
🔎Analysis summary:
Over the past couple of months, Nvidia managed to rally about +100%, reaching top 1 of total market cap. Most of the time such bullish momentum just continues and new all time highs will follow. But in order for that to happen, Nvidia has to confirm the all time high breakout now.
📝Levels to watch:
$150
🙏🏻#LONGTERMVISION
SwingTraderPhil

NVDA: 173.50RECOMMENDED ENTRIES: Bullish (174.30/175.00) Target: (176.00 – 177.00) Stop (173.50) Bearish: (173.00/172.00) Target: (172.00 – 170.00) Stop (174.00) Note: 174.00 double top

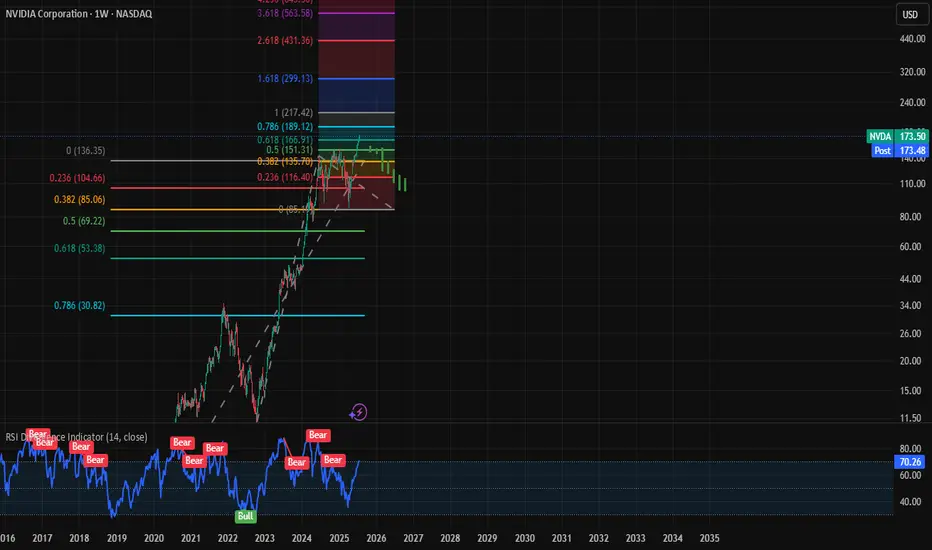
Nvidia HTF Wykoff Distribution PatternHTF Wykoff Distribution pattern in confluence with HTF fib trend/extension and fibonnacci time.
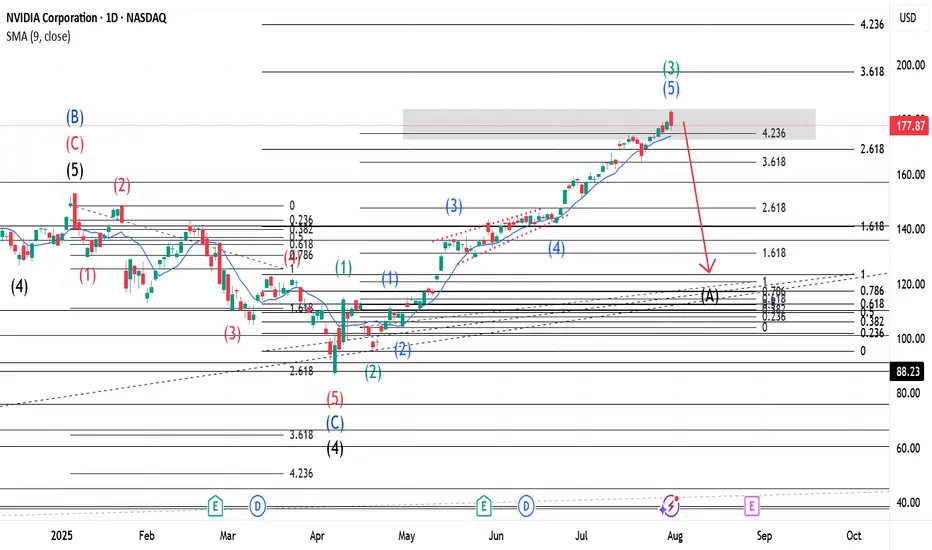
$NVDA ~ An Elliott Wave Breakdown.Earlier in the main wave, our Wave 2(Black) was a Zigzag hence a Flat was expected for Wave 4(Black). Wave B(Blue) closed beyond Wave 3(Black) and our Wave 4 made a 5 wave move(Shown in Red) that retested at the 261.8% Fib. level. With Wave C(Blue) complete, it was coined Wave 4(Black). Wave 5(Black) was launched and has a 5 wave move shown in Green. With a Zigzag for Wave 2(Green), a Flat should be expected for Wave 4(Green). Wave 3(Green) has 5 waves with a triangle for Wave 4(Blue). A confirmation at its current location(423.6% Fib. level) would mean that Wave 3(Green) is complete and a Wave A(Black) of the previously mentioned Flat should be anticipated. Please check my detailed breakdown for a broader perspective into the same.
NB: The placement of Wave A(Black) of the Flat mentioned above is purely for demonstrative purposes.
Catch the bounce on NVDAHi, I'm The Cafe Trader.
We’re taking a deeper dive into NVIDIA (NVDA) — one of the leaders in the MAG 7 — with a short-term trade setup you can apply to both shares and options.
Setup Context:
NVDA is pushing into all-time highs, and we’re now approaching the average analyst price target (around $180). While we don’t know how price will react at this level, traders should be watching for pullbacks and trend continuations — prime zones for entry.
If we get a strong move down, I see $153 as a high-probability bounce area — where buyers are likely to step in aggressively.
Price Target Outlook:
The final price target will depend on how price moves into this zone:
- If NVDA runs to $200 before pulling back, targets shift higher.
- If it tops out around $180, we adjust accordingly.
That said, an initial bounce toward $169–$170 looks reasonable.
Options Note:
If NVDA sells off hard and fast, implied volatility (IV) will spike, making options expensive and reducing your edge. This is a setup that could play out over 2–3 weeks, but the first bounce could be quick — so timing matters.
Strategy: Staggered Entry Using Two Contracts
Use two contracts — one short-term, one mid-term — to maximize reward while managing time decay.
Contract 1: Short-Term (3–5 Days to Expiry)
Trigger Entry: As soon as price taps the demand zone (~$153)
Strike Entry Price ^^Target Price
155 $2.00 ^^ $6.00
157.5 $1.50 ^^ $4.50
160 $0.75 ^^ $2.50
You’re looking for a quick reaction: get in, take profit, and step aside while the market finds new balance.
Contract 2: Medium-Term (7–10 Days to Expiry)
Timing Tip: Wait for NVDA to stall or consolidate after the initial bounce — this is when IV comes down and contracts get cheaper.
Strike Entry Price ^^Target Price
155 $3.00 ^^ $15.00
157.5 $2.50 ^^ $12.50
160 $1.80 ^^$9.00
Important: Be careful trading too close to earnings. Contracts tend to get overpriced right before and after earnings drops.
That wraps up the short-term NVDA view.
Stay tuned for more trades and setups across the MAG 7.
@thecafetrader
Take care, and happy trading!

NVIDIANVIDIA Corporation is a leading American technology company known for designing and manufacturing graphics processing units (GPUs), system-on-a-chip units (SoCs), and AI computing platforms. Founded in 1993, the company originally focused on gaming graphics but has since evolved into a global powerhouse in artificial intelligence, data centers, autonomous vehicles, and high-performance computing. NVIDIA’s GPUs are widely used not only in gaming and visual computing but also in scientific research, AI model training, machine learning, and cloud infrastructure.
In recent years, NVIDIA has been at the forefront of the global AI boom. Its data center business, powered by its high-end GPU architecture (like the H100 and newer generations), has become a critical backbone for tech companies, cloud providers, and governments seeking to build large-scale AI systems. The company also made major strategic moves through acquisitions and software integration, further solidifying its dominance in the AI hardware space. NVIDIA’s strong financial performance and technological leadership led to rapid growth in its market capitalization, briefly making it one of the most valuable companies in the world.
As of August 2025, NVIDIA’s stock is trading at $173.60 per share, following a stock split that adjusted its price while increasing liquidity. Despite broader market volatility, NVIDIA remains a key player driving the AI revolution and is closely watched by investors and analysts. Its valuation continues to be shaped by demand for AI chips, innovation in GPU architecture, and its ability to maintain technological leadership amid growing global competition. NVIDIA stands at the intersection of multiple megatrends, making it a critical stock in both the technology and semiconductor sectors.

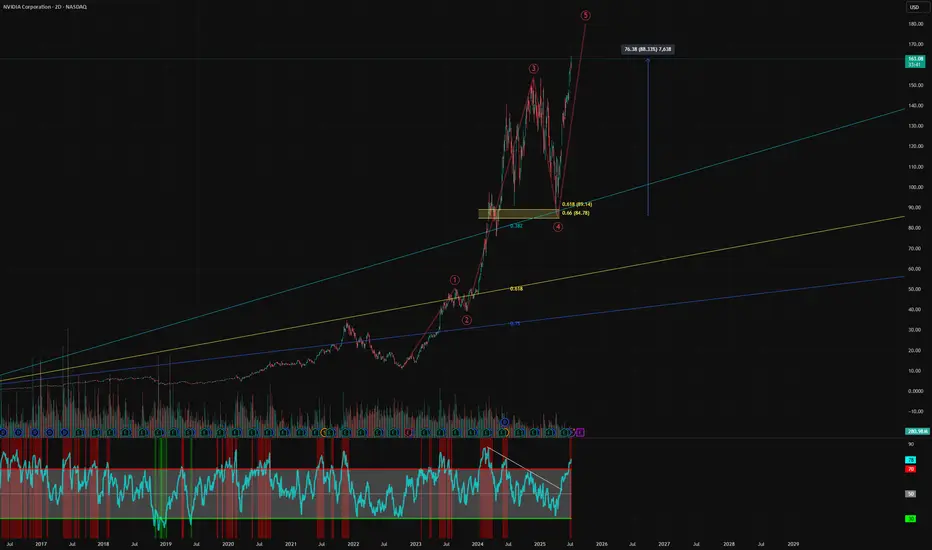
Nvidia - Blow off top?Time to book some AI stock profits, I have exited ARM and today I am taking profits on Nvidia. We entered at the golden pocket, up over 88% since the recent lows. I am now scaling out of my position, starting with 50% of my total. I will use a trailing stop loss for the rest.
We have hit a 4 trillion dollar market cap, more than the entire UK stock market combined. Am I bearish on Nvidia? Of course not, but the market is getting greedy and I like to book profits.
I love the company, but I expect huge volatility going forward.
Not financial advice, do what's best for you.
$NVDA ~ An Elliott Wave Breakdown.(Detailed Spectrum)Our Wave 2(Black) of the main wave was a Zigzag hence a Flat for Wave 4(Black). When Wave 3(Black) completed a three wave move, shown in Green, was made, hence A(Blue). Wave B(Blue) went beyond the end of 3(Black) and had 3 waves, shown in Red, also(as expected for Flats). The last of this 3 wave move(Wave c-Red) had 5 waves shown in Black. Upon completion, our Wave B(Blue) was over and we expected a Wave 4(Black). Our Wave 4 made a 5 wave move(Shown in Red) that retested at the 261.8% Fib. level. With Wave C(Blue) complete, it was coined Wave 4(Black). Wave 5(Black) was launched and has a 5 wave move shown in Green. With a Zigzag for Wave 2(Green), a Flat should be expected for Wave 4(Green). Wave 3(Green) has 5 waves with a triangle for Wave 4(Blue). A confirmation at its current location(423.6% Fib. level) would mean that Wave 3(Green) is complete and a Wave A(Black) of the previously mentioned Flat should be anticipated.
NB: The placement of Wave A(Black) of the Flat mentioned above is purely for demonstrative purposes.
Nvidia’s Historic 2025 Stock Rally: What’s Driving It?Nvidia’s stock has once again captivated Wall Street in 2025, breaking records and fueling debates on whether its blistering momentum will continue or eventually ease. Here’s an in-depth look at why Nvidia is surging, the key drivers behind the rally, and what the long-term future could hold.
Nvidia’s Stock Rally: By the Numbers
As of July 2025, Nvidia stock has rallied more than 39% year-to-date, reaching new all-time highs above $170 and propelling the company’s market cap past $4 trillion, the largest in the world.
The stock has added nearly $2 trillion in valuation since April, outpacing tech giants like Microsoft and Apple.
Analyst price targets for the rest of 2025 vary: the average ranges from ~$174 to ~$235, with bullish forecasts up to $250 and more cautious targets down to $135.
What’s Powering the Rally?
1. Surging AI Demand:
Nvidia remains at the center of the artificial intelligence (AI) boom. Its graphics and AI accelerator chips (notably the new Blackwell AI family) are the backbone of AI infrastructure for Global Tech firms (Amazon, Meta, Microsoft, Google) and cloud service providers. This AI-centric demand has kept revenue growth robust and margins high (approaching 70%).
2. Easing China Trade Fears:
Earlier in 2025, U.S.–China export controls severely restricted Nvidia’s sales of advanced AI chips like the H20 to Chinese customers, causing a temporary selloff. However, a subsequent pause on tariffs by the U.S. and optimism about renewed China shipments reignited investor confidence, helping reverse earlier losses and extending the rally.
3. Massive Tech Investment Cycle:
The global rush to build out AI infrastructure is bringing huge investments from U.S. and international hyperscalers. Meta and Amazon alone have announced plans to pour “hundreds of billions” into AI data centers, much of it destined for Nvidia-powered hardware.
4. Strong Fundamentals and Diversification:
Nvidia sports some of the highest profit margins among mega-cap tech stocks. Its free cash flow, dominant market share, and expanding ecosystem, including platforms like Omniverse (for 3D and digital twins) and Drive (autonomous vehicles)—cement its leadership well beyond just chips.
What Could Slow Nvidia Down?
Despite the excitement, several risks linger:
Valuation Concerns: Nvidia trades at a premium (P/E above 50 for trailing earnings), raising worries of a pullback if growth slows.
Geopolitical and Regulatory Threats: Further U.S.-China tensions, new export regulations, or rising competition from rivals like AMD, Huawei, or custom silicon at cloud giants could erode growth or margins.
Cyclicality of the AI Boom: Some market watchers worry that AI infrastructure spending could prove cyclical, making Nvidia’s revenue growth more volatile in future years.
The Long-Term Outlook (2025 & Beyond)
Bullish Case: Most analysts expect continued dominance for Nvidia as AI, autonomous vehicles, robotics, and edge computing keep growing exponentially. Price targets range as high as $250 for 2025, climbing to $1,000+ by 2030 if AI adoption continues its rapid expansion.
Base Case: Moderate growth continues into 2026–2027, with a price target cluster around $180–$235 (2025) and $200–$428 (2027), assuming AI demand moderates, margins remain stable, and Nvidia fends off competitive threats.
Bearish Case: If U.S.-China relations sour and hyperscaler spending slows, the stock could retest support levels ($135–$150). However, few analysts expect a sustained collapse unless there is a fundamental change in AI or chip technology trends.
#nvda #stockmarket #finance #revenue #profit #financials #economy #technology #ai #chips
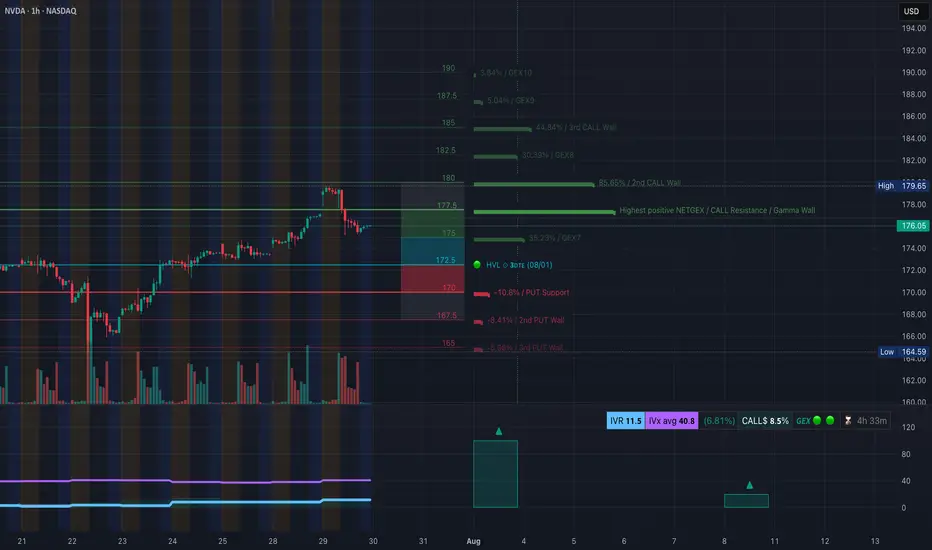
NVDA Rejection From Supply! July 30NVDA Rejection From Supply! Will Gamma Walls Trap Bulls Below 178? 🔥
🧠 GEX-Based Options Outlook (1H GEX Chart)
NVDA currently trades around $176, just below the key Gamma Wall at $178, which aligns with the Highest Positive NETGEX zone and a Call Wall cluster between $178–$180. This setup suggests that any move above $178 will face strong gamma resistance, and market makers will likely hedge by shorting, making it harder for price to rally.
* GEX Zones Overview:
* Strongest Call Walls: $180, $182.5, $185
* Gamma Wall: $178 (Major resistance)
* PUT Walls: $170, $167.5, $165 (Defensive zones)
* IVR is very low at 11.5, and IVx is near average at 40.8 — implying premiums are cheap, and buyers of options may benefit if volatility spikes.
📉 Bias: Neutral-to-Bearish short-term unless NVDA cleanly reclaims $178 with volume.
💡 Options Suggestions:
* Put Debit Spread: Buy 175 Put / Sell 170 Put (limited risk, targeting a move to GEX7 zone)
* Call Credit Spread: Sell 178 Call / Buy 182.5 Call (fade the resistance zone with defined risk)
* Directional Put: Buy 175 Put for potential flush to 172 or lower if GEX support fails
📊 1-Hour Intraday Technical Analysis
Market Structure & Smart Money Concepts:
* A clear Change of Character (CHoCH) occurred after price failed to hold the ascending trendline from July 24–29.
* Break of Structure (BOS) at $176.75 confirmed the shift from bullish to corrective.
* Price is now under the order block rejection zone (highlighted pink) and has respected a bearish supply reaction.
Support/Resistance:
* 🔻 Resistance: $176.75 (previous BOS), $178 (Gamma Wall)
* 🟢 Support: $172.94 (FVG zone) and strong PUT wall at $170
* Critical liquidity zone sits between $165–$168 — this is a potential magnet if downside accelerates.
EMA 9/21 Status:
* Bearish crossover already triggered.
* Price now trades below both EMAs, reinforcing bearish short-term control.
Volume Analysis:
* Last few red candles show increasing sell volume — institutional exit or short entry likely occurred.
🔀 Scenarios to Watch
Bullish Intraday Setup:
* If NVDA reclaims $176.75 with strong momentum and breaks above $178 (Gamma Wall), potential to squeeze to $180 and $182.5.
* Entry: $177.20+ reclaim
* Stop: $175.90
* Target: $179.65 → $182.50
* ⚠️ Needs strong volume and VIX relief to work
Bearish Intraday Setup (High-Probability):
* Price stays below $176 → fade any retest of $176.75
* Entry: $175.90 or below
* Stop: $177.30
* Target 1: $172.94
* Target 2: $170
* Extended: $167.5 if GEX support collapses
📌 Final Thoughts
NVDA just triggered a bearish shift in structure after a strong run. With IV still low and GEX pressure mounting at the $178 level, the setup leans more toward bearish-to-sideways chop unless bulls reclaim key resistance. Ideal strategy is to fade into resistance and scale out near the lower GEX walls.
This analysis is for educational purposes only and does not constitute financial advice. Always do your own research and trade responsibly.
envidia drops from 173.50 to 130 ish or less to 104.00technical prediction based on the volumes pattern when sellers position themselves before the giant crash
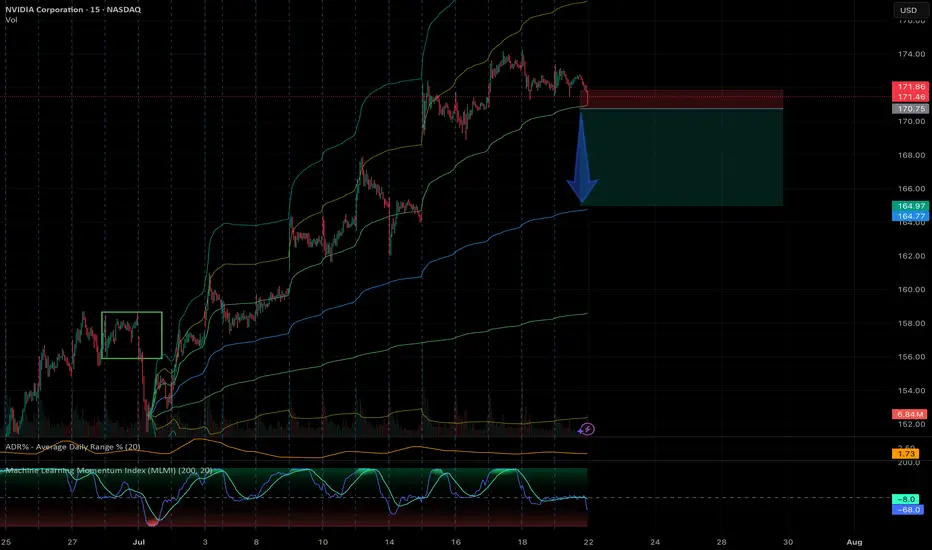
NVDA - AVWAP Breakdown15 Min MLMI appears to be breaking down, meaning that it will continue to fall further.
Stock likely to pull back to the monthly AVWAP level around $165.