Catch the bounce on NVDAHi, I'm The Cafe Trader.
We’re taking a deeper dive into NVIDIA (NVDA) — one of the leaders in the MAG 7 — with a short-term trade setup you can apply to both shares and options.
Setup Context:
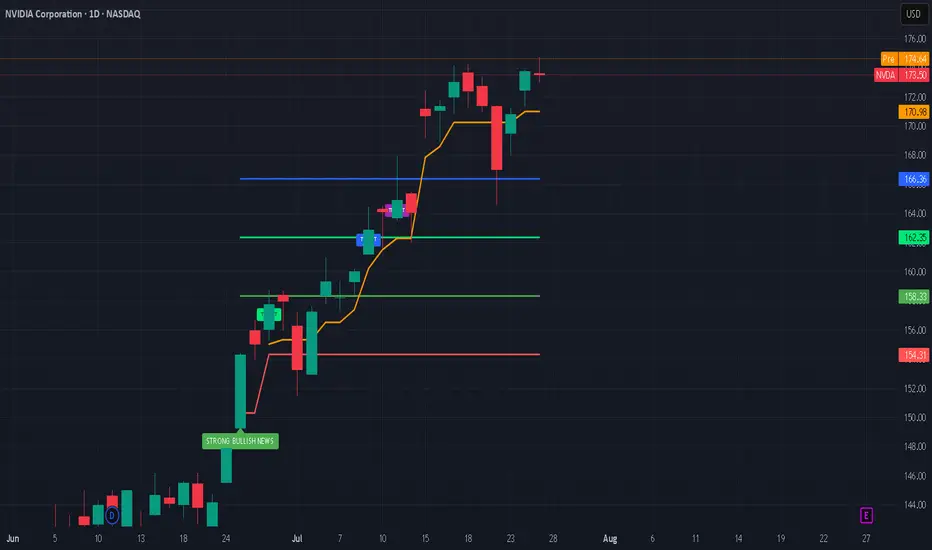
NVDA is pushing into all-time highs, and we’re now approaching the average analyst price target (around $180). While we don’t know how price will react at this level, traders should be watching for pullbacks and trend continuations — prime zones for entry.
If we get a strong move down, I see $153 as a high-probability bounce area — where buyers are likely to step in aggressively.
Price Target Outlook:
The final price target will depend on how price moves into this zone:
- If NVDA runs to $200 before pulling back, targets shift higher.
- If it tops out around $180, we adjust accordingly.
That said, an initial bounce toward $169–$170 looks reasonable.
Options Note:
If NVDA sells off hard and fast, implied volatility (IV) will spike, making options expensive and reducing your edge. This is a setup that could play out over 2–3 weeks, but the first bounce could be quick — so timing matters.
Strategy: Staggered Entry Using Two Contracts
Use two contracts — one short-term, one mid-term — to maximize reward while managing time decay.
Contract 1: Short-Term (3–5 Days to Expiry)
Trigger Entry: As soon as price taps the demand zone (~$153)
Strike Entry Price ^^Target Price
155 $2.00 ^^ $6.00
157.5 $1.50 ^^ $4.50
160 $0.75 ^^ $2.50
You’re looking for a quick reaction: get in, take profit, and step aside while the market finds new balance.
Contract 2: Medium-Term (7–10 Days to Expiry)
Timing Tip: Wait for NVDA to stall or consolidate after the initial bounce — this is when IV comes down and contracts get cheaper.
Strike Entry Price ^^Target Price
155 $3.00 ^^ $15.00
157.5 $2.50 ^^ $12.50
160 $1.80 ^^$9.00
Important: Be careful trading too close to earnings. Contracts tend to get overpriced right before and after earnings drops.
That wraps up the short-term NVDA view.
Stay tuned for more trades and setups across the MAG 7.
@thecafetrader
Take care, and happy trading!
NVDA trade ideas

NVDA-the AI TitanNVIDIA (NVDA) continues to dominate the AI semiconductor space and remains one of the strongest momentum names in the market. After reaching new highs, price action is now offering a clean multi-tiered entry opportunity for swing traders positioning for the next leg up.
Entry Points
✅ $160 – Breakout retest zone
✅ $145 – Key technical support
✅ $130 – Strong demand zone from prior consolidation
Profit Targets
📈 TP1: $180
🚀 TP2: $190
💰 TP3: $200+
📌 Disclaimer: This is not financial advice. Just sharing my view and trade idea. Always do your own research and manage risk accordingly.

Nvidia’s Historic 2025 Stock Rally: What’s Driving It?Nvidia’s stock has once again captivated Wall Street in 2025, breaking records and fueling debates on whether its blistering momentum will continue or eventually ease. Here’s an in-depth look at why Nvidia is surging, the key drivers behind the rally, and what the long-term future could hold.
Nvidia’s Stock Rally: By the Numbers
As of July 2025, Nvidia stock has rallied more than 39% year-to-date, reaching new all-time highs above $170 and propelling the company’s market cap past $4 trillion, the largest in the world.
The stock has added nearly $2 trillion in valuation since April, outpacing tech giants like Microsoft and Apple.
Analyst price targets for the rest of 2025 vary: the average ranges from ~$174 to ~$235, with bullish forecasts up to $250 and more cautious targets down to $135.
What’s Powering the Rally?
1. Surging AI Demand:
Nvidia remains at the center of the artificial intelligence (AI) boom. Its graphics and AI accelerator chips (notably the new Blackwell AI family) are the backbone of AI infrastructure for Global Tech firms (Amazon, Meta, Microsoft, Google) and cloud service providers. This AI-centric demand has kept revenue growth robust and margins high (approaching 70%).
2. Easing China Trade Fears:
Earlier in 2025, U.S.–China export controls severely restricted Nvidia’s sales of advanced AI chips like the H20 to Chinese customers, causing a temporary selloff. However, a subsequent pause on tariffs by the U.S. and optimism about renewed China shipments reignited investor confidence, helping reverse earlier losses and extending the rally.
3. Massive Tech Investment Cycle:
The global rush to build out AI infrastructure is bringing huge investments from U.S. and international hyperscalers. Meta and Amazon alone have announced plans to pour “hundreds of billions” into AI data centers, much of it destined for Nvidia-powered hardware.
4. Strong Fundamentals and Diversification:
Nvidia sports some of the highest profit margins among mega-cap tech stocks. Its free cash flow, dominant market share, and expanding ecosystem, including platforms like Omniverse (for 3D and digital twins) and Drive (autonomous vehicles)—cement its leadership well beyond just chips.
What Could Slow Nvidia Down?
Despite the excitement, several risks linger:
Valuation Concerns: Nvidia trades at a premium (P/E above 50 for trailing earnings), raising worries of a pullback if growth slows.
Geopolitical and Regulatory Threats: Further U.S.-China tensions, new export regulations, or rising competition from rivals like AMD, Huawei, or custom silicon at cloud giants could erode growth or margins.
Cyclicality of the AI Boom: Some market watchers worry that AI infrastructure spending could prove cyclical, making Nvidia’s revenue growth more volatile in future years.
The Long-Term Outlook (2025 & Beyond)
Bullish Case: Most analysts expect continued dominance for Nvidia as AI, autonomous vehicles, robotics, and edge computing keep growing exponentially. Price targets range as high as $250 for 2025, climbing to $1,000+ by 2030 if AI adoption continues its rapid expansion.
Base Case: Moderate growth continues into 2026–2027, with a price target cluster around $180–$235 (2025) and $200–$428 (2027), assuming AI demand moderates, margins remain stable, and Nvidia fends off competitive threats.
Bearish Case: If U.S.-China relations sour and hyperscaler spending slows, the stock could retest support levels ($135–$150). However, few analysts expect a sustained collapse unless there is a fundamental change in AI or chip technology trends.
#nvda #stockmarket #finance #revenue #profit #financials #economy #technology #ai #chips
NVDA: 173.50RECOMMENDED ENTRIES: Bullish (174.30/175.00) Target: (176.00 – 177.00) Stop (173.50) Bearish: (173.00/172.00) Target: (172.00 – 170.00) Stop (174.00) Note: 174.00 double top

NVDA 0DTE TRADE SIGNAL – JULY 25, 2025
⚡ NVDA 0DTE TRADE SIGNAL – JULY 25, 2025 ⚡
🚀 Strong Bullish Momentum – But Friday Expiration = Gamma Trap?
⸻
📊 Market Stats:
• 💰 Call Volume: Strong
• 🔻 Weak Volume Overall
• ⚖️ Call/Put Ratio: Bullish
• 📈 RSI: Overbought but still pushing
• ⏳ Time Decay: Accelerating
• ☠️ Gamma Risk: 🔥 MAX today (0DTE)
⸻
🧠 Model Summary:
• Grok/xAI: 🔒 NO TRADE today – wait for Monday
• Claude: 🛑 Caution – avoid entries today
• DeepSeek: ⏸️ 4/5 Bullish, wait for cleaner setup
• Gemini: 💡 Suggests $180C next week
• Llama: ✅ Bullish bias, but gamma risk = no go for Friday
⸻
📌 TRADE IDEA: Wait for Monday
📍 Strike: $175 Call
📆 Expiry: Today (0DTE)
💵 Entry Price: $0.56
🎯 Target: $0.95
🛑 Stop: $0.30
📈 Confidence: 65%
🕒 Entry Timing: Monday open IF support holds
⸻
⚠️ Key Warning:
Don’t get trapped by 0DTE gamma swings. Momentum says yes, time decay says no…
✅ Best move? Watch NVDA closely, then strike on Monday if volume confirms.
⸻
👍 Like & save if you’re tracking NVDA.
🔁 Repost if you’re waiting for the perfect Monday setup!
#NVDA #OptionsTrading #0DTE #GammaRisk #BullishSetup #TradingView #TechStocks #WeeklyOptions

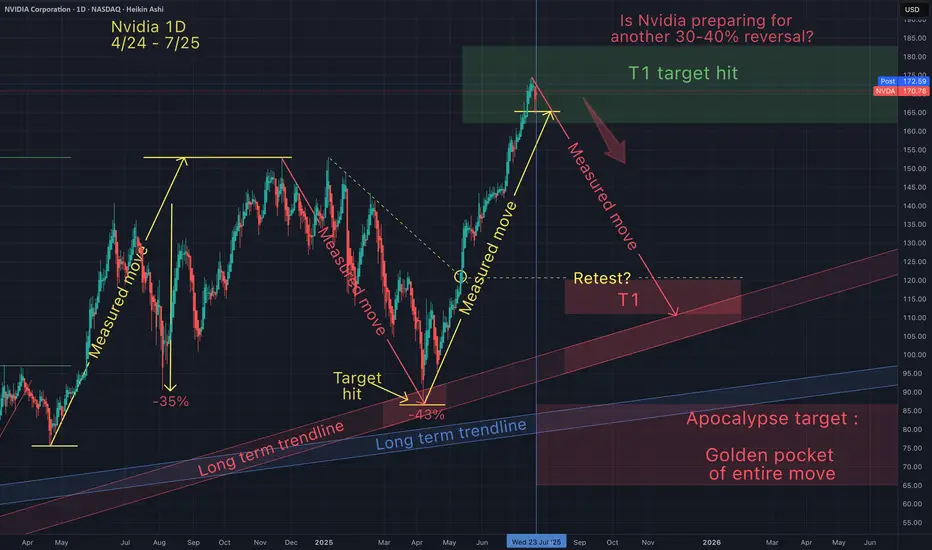
NvidiaIs Nvidia preparing for another 30-40% reversal. I hope not!
But I do want to be prepared in case we do get another dip buying opportunity.
Rare Buying OpportunityBig players are quietly accumulating NASDAQ:NVDA — time to join in.
NASDAQ:NVDA isn’t just a stock — it’s the future of AI.
This pullback? A gift in disguise. #BuyTheDip
Expect to take profits very soon.

NVDA at a Make-or-Break Level. TA for Aug. 6🚀 NVDA at a Make-or-Break Level — Key GEX & Price Action Signals
Technical Overview (1H Chart)
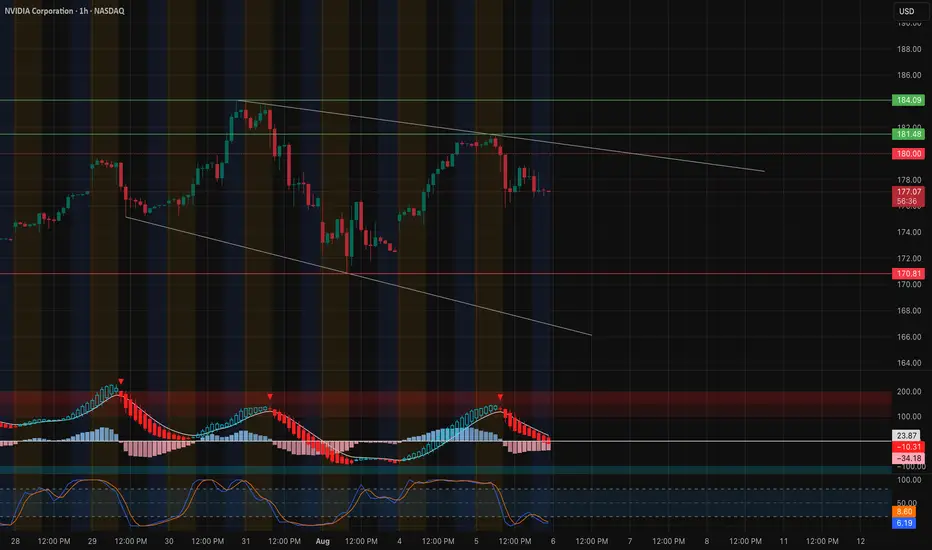
NVDA is currently trading around 177.15, sitting just under the 180 psychological and technical resistance. Price action remains inside a descending channel, with sellers defending the 180 level while buyers have been active near 175.
The recent bounce from 170.80 aligns with the bottom channel support, but the lack of strong follow-through shows hesitation ahead of heavy resistance.
Gamma Exposure (GEX) Insights
* Major Call Walls:
* 180 → Highest positive GEX & Gamma Wall resistance.
* 184.09–185 → 2nd Call Wall cluster, significant dealer hedging pressure if broken.
* Put Support Zones:
* 175 → Strong GEX-based put support; losing this could accelerate downside.
* 170.80 → Major pivot & prior low, last strong GEX defense.
* Dealers are positioned in a way that staying below 180 keeps upside contained, while a clear breakout above 180 could trigger dealer covering and a squeeze toward 184–185.
Momentum & Oscillators
* MACD → Bearish momentum cooling off but still in the red, suggesting consolidation.
* Stoch RSI → Oversold zone, signaling potential short-term bounce attempt.
Trade Scenarios
* Bullish Case: Break & hold above 180 opens the door for 184–185 retest. Option traders could target near-term calls above 180 with tight stops.
* Bearish Case: Rejection at 180 and drop back under 175 could lead to 170.80 retest. Ideal for puts targeting 175 → 171 zone.
Options Trading Thoughts (Based on GEX)
* Preferred Bullish Setup: Wait for confirmed breakout over 180 → Calls targeting 184 strike, short expiry for momentum.
* Preferred Bearish Setup: Puts if rejection at 180 holds & price slips below 175, targeting 172–171 zone.
Disclaimer: This analysis is for educational purposes only and not financial advice. Always manage your risk.
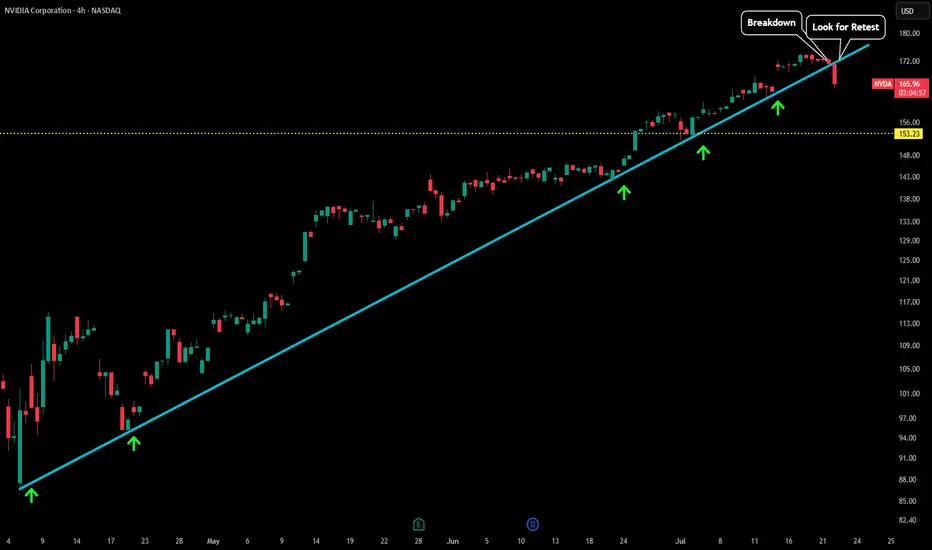
NVDA - Few Warning Signs Please refer to our previous post:
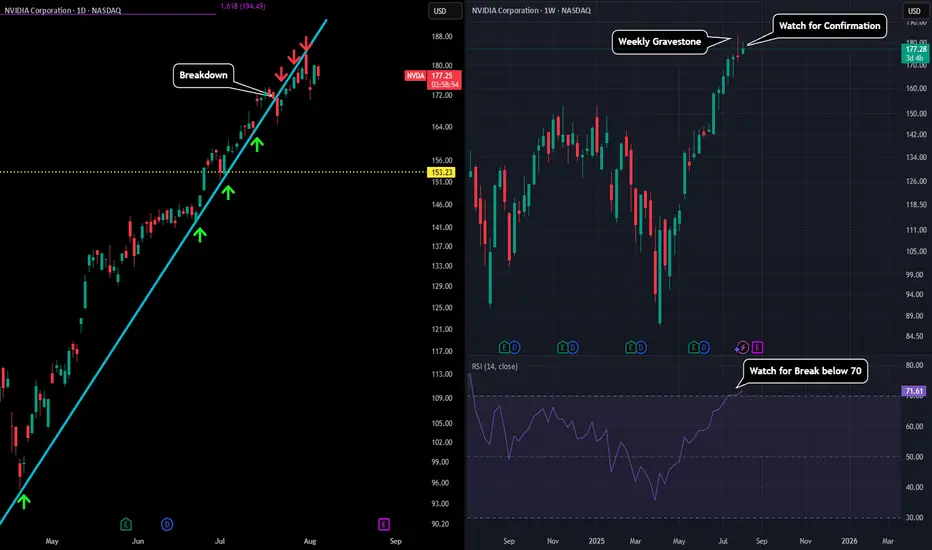
Here we were pointing out the structural break of our blue trendline on the daily. It acted as support the whole way up (green arrows) and now has been flipped into resistance so far (red arrows).
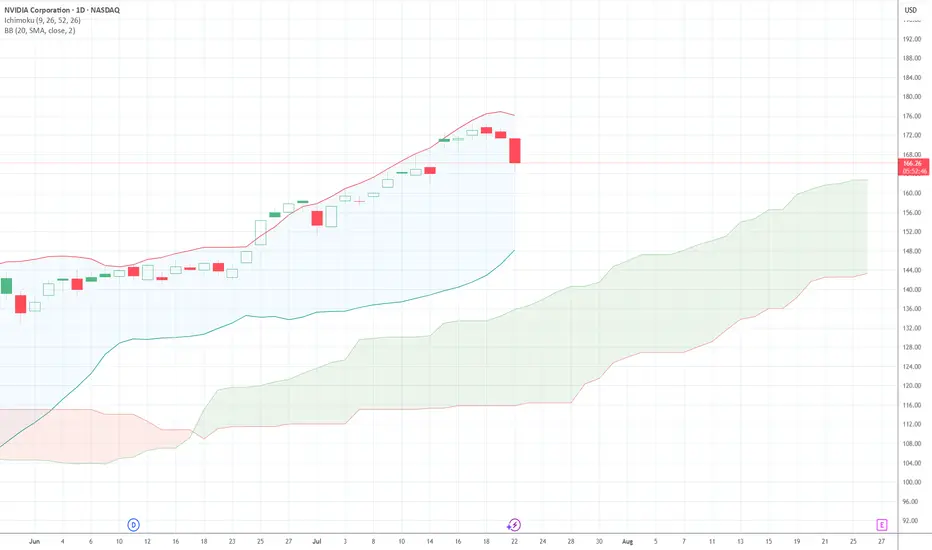
Also if you look at the chart on the right we had a MAJOR bearish signal flash. A weekly gravestone doji formed which could end up marking the top. We haven't had the confirmation yet, but depending on how price action play out this week we could have a very good idea of what next.
If we see bearish momentum and this weekly candle flip red that could be the first sign of this gravestone marking the top as it is a reversal candle. That would also send our strength on the RSI below the 70 which could look as a rejection from overbought conditions.
However, if we are able to maintain this weekly candle green (better yet break the gravestone doji high) that would show strength bouncing from overbought and send us towards that $200 target.
Nothing left of nvidia when quantum compute takes over graphicsNothing left of nvidia when quantum compute takes over graphics. The price would go from 200 to 20 in no time (several years)
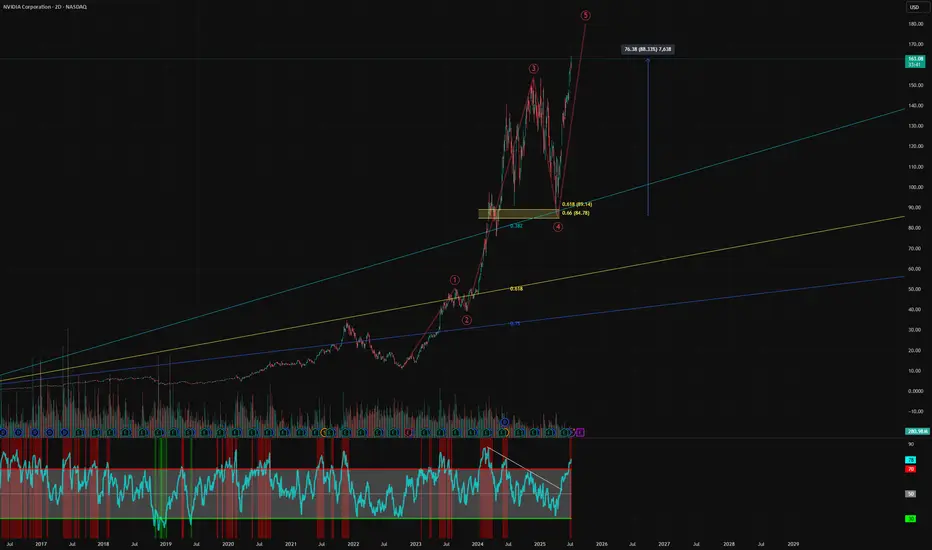
Potential Correction Time: NVDAIt may be the time for NVDA to complete the 5th wave. The next move will become the corrective wave (ABC).
Target price 1: 14x
Target price 2: 13x to 12x
NVDA Short IdeaThis bearish rising wedge just had a failed upside breakout, followed by a 5 wave move to test the lower trendline, and followed by a potential dead cat bounce. I’m short, with stop loss set if new highs are set.
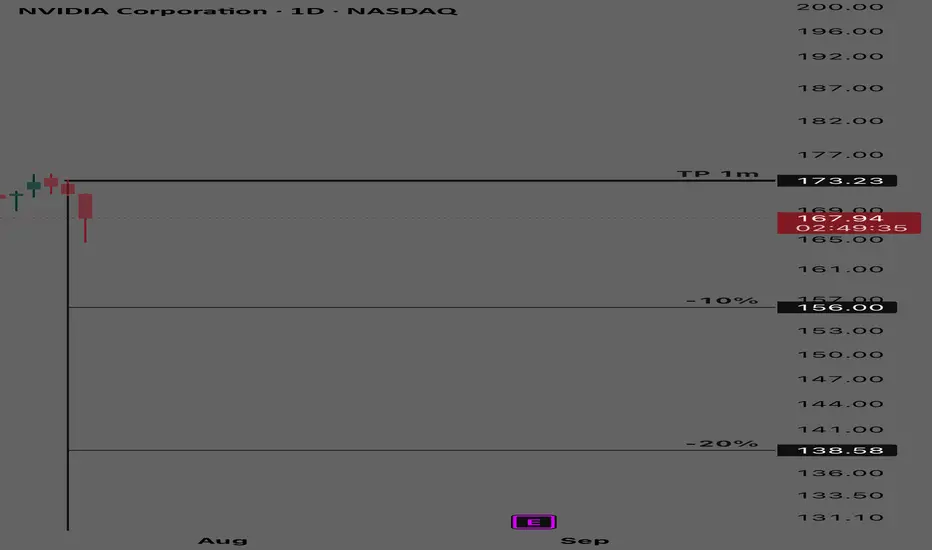
NVIDIA - Short Term Buy CycleNvidia
Short term buy cycle
TP at 173.23
% bubble ratio
Today NVIDIA entered into a short term buy cycle (negative bubble) with fair value at 173.23
Spot trading plan:
Start to buy at (-10% bubble ratio) and below
TP at 173
NVDA stocks Buy Trade with Take Profit - Stocks SPOT ACCOUNTStocks SPOT ACCOUNT:
NASDAQ:NVDA stocks my buy trade with take profit.
This is my SPOT Accounts for Stocks Portfolio.
Trade shows my Buying and Take Profit Level.
Spot account doesn't need SL because its stocks buying account.

NVDA - LTF Breakdown This is an update to our last post:
After finding support upon this trendline for so many test we are now seeing the first signs of weakness. As soon as price fell below our trendline we saw a very sharp decline in price.
Now that trendline could act as a new level of resistance. Any test back to the upside could be a test of blue trendline as resistance + test of last high (which could create some sort of double top). Will update this post when more developments occur.
$NVDA filled the gap. NASDAQ:NVDA filled the gap on the downside. A lot of bearish flow came in yesterday. But today the flow was bullish early.
Nvidia - Blow off top?Time to book some AI stock profits, I have exited ARM and today I am taking profits on Nvidia. We entered at the golden pocket, up over 88% since the recent lows. I am now scaling out of my position, starting with 50% of my total. I will use a trailing stop loss for the rest.
We have hit a 4 trillion dollar market cap, more than the entire UK stock market combined. Am I bearish on Nvidia? Of course not, but the market is getting greedy and I like to book profits.
I love the company, but I expect huge volatility going forward.
Not financial advice, do what's best for you.
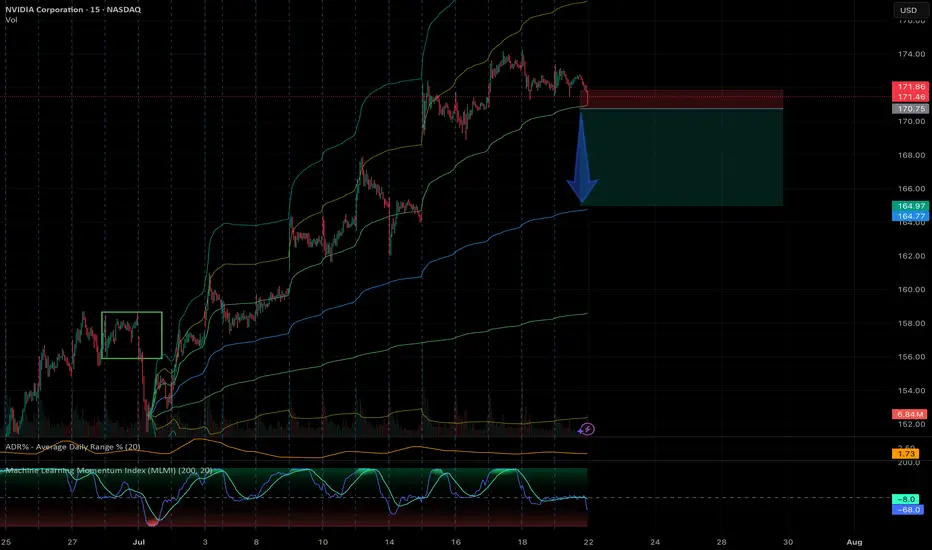
NVDA - AVWAP Breakdown15 Min MLMI appears to be breaking down, meaning that it will continue to fall further.
Stock likely to pull back to the monthly AVWAP level around $165.
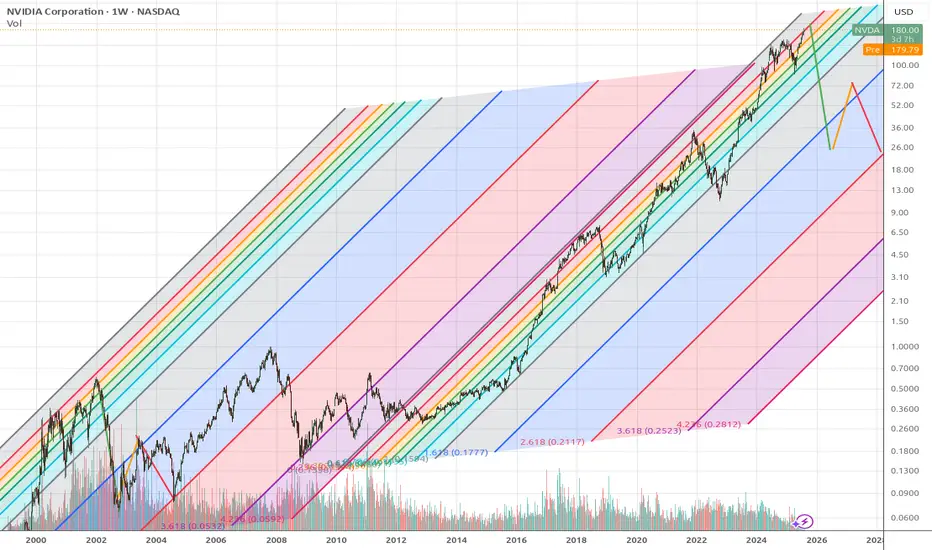
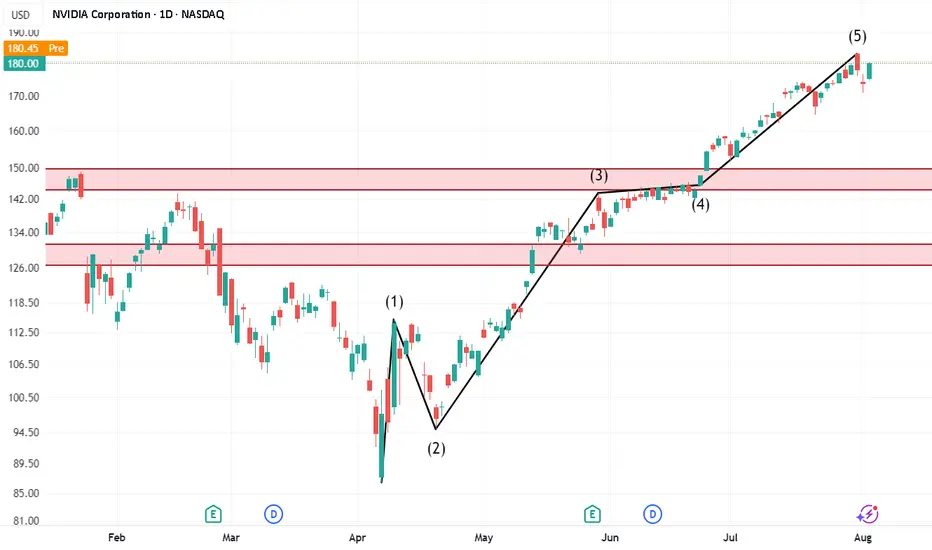
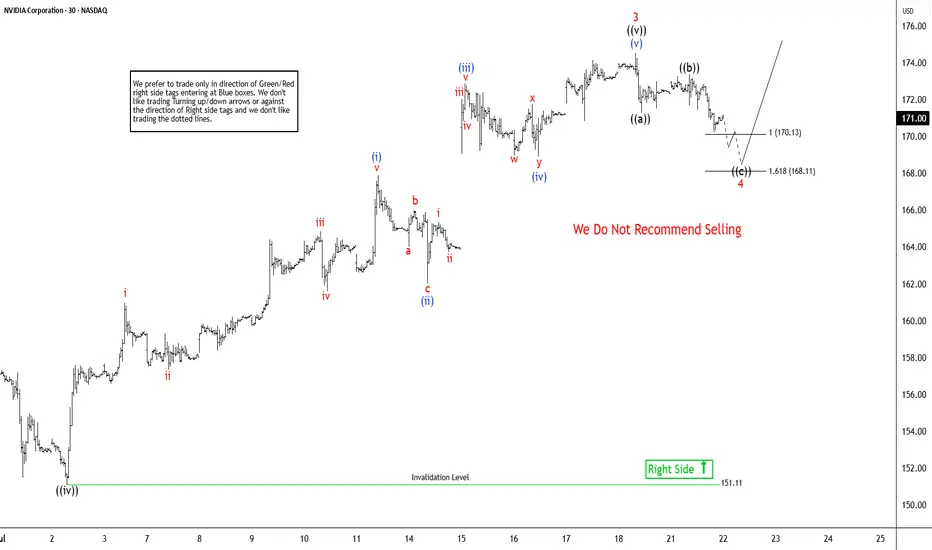
Elliott Wave Sequence In NVDA Suggests Rally From SupportNvidia (NVDA) continues rally to new all-time highs from April-2025 low and reinforcing a robust bullish outlook. In daily, it ended 7 swings pullback at 86.62 low in 4.07.2025 low started from 1.07.2025 high. Above April-2025 low, it confirmed higher high bullish sequence & pullback in 3, 7 or 11 swings should remain supported. Since April-2025 low, it favors rally in (3) of ((1)), while placed (1) at 115.44 high & (2) at 95.04 low in 4.21.2025. Above there, it placed 1 of (3) at 143.84 high, 2 as shallow connector at 132.93 low & 3 at 174.53 high. Wave (3) already extend beyond 2.0 Fibonacci extension of (1) & yet can see more upside. Within 1 of (3), it ended at ((i)) at 111.92 high, ((ii)) at 104.08 low, ((iii)) at 137.40 high, ((iv)) at 127.80 low & ((v)) at 143.84 high. Above 2 low, it placed ((i)) of 3 at 144 high, ((ii)) at 137.88 low, ((iii)) at 159.42 high, ((iv)) at 151.10 low & ((v)) at 174.53 high as 3 of (3).
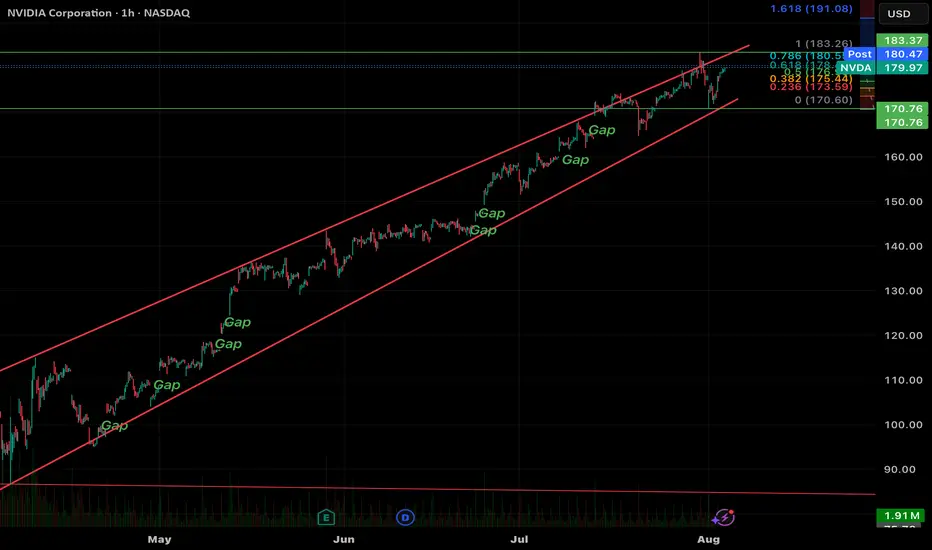
It already reached the minimum area of 170.04 as inverse extension of connector. But it can see more upside as daily move showing highest momentum from April-2025 low. In 1-hour, above ((iv)) low, it placed (i) of ((v)) at 167.89 high in 5 swings, (ii) at 162.02 low, (iii) at 172.87 high, (iv) at 168.90 low & (v) of ((v)) at 174.53 high ended as 3. Currently, it favors pullback in 4 targeting into 170.13 - 168.11 area before rally in 5 or at least 3 swing bounce. Within 4, it ended ((a)) at 171.26 low, ((b)) at 173.38 high & favors lower in ((c)) of 4. It should find support in extreme area soon to turn higher for two more highs to finish ((1)). The next move in 5 of (3) can extend towards 175.9 or higher, while pullback stays above 168.11 low. The next two highs expect to come with momentum divergence to finish cycle from April-2025 low. Later it should see bigger pullback against April-2025 low in 3, 7 or 11 swings. But if it extends higher & erase momentum divergence, then it can see more upside.
Nvidia Hits New Highs, But Is the Rally Losing Steam?NVIDIA (NVDA) just keeps climbing in 2025! It's been an incredible run, fueled by insatiable demand for AI technology and a wave of investor optimism. The stock has rocketed to fresh highs, pushing its P/E ratio above 54. That's way higher than what we typically see in the industry, making many wonder if it's getting a bit too pricey.
Now, looking at the charts, NVDA was actually caught in a rising wedge pattern. Think of it like a funnel narrowing at the top – it often hints that a stock might be ready for a pullback. Last week, it seemed to break out of the top of that wedge, which usually signals more good times ahead. But here's the kicker: this breakout happened on weakening momentum. Both the RSI (a measure of how fast prices are changing) and trading volume were telling a different story, showing a divergence that suggests the underlying buying power might be fading.
So, despite this impressive climb, these technical signals are whispering a word of caution. While the overall uptrend is still intact, that fading strength behind the move could mean we're heading for some consolidation or even a short-term pullback. Investors might want to keep a close eye on things and wait for clearer signs before jumping in at these elevated levels.
(Disclaimer : This is not financial advice. Always do your own research)

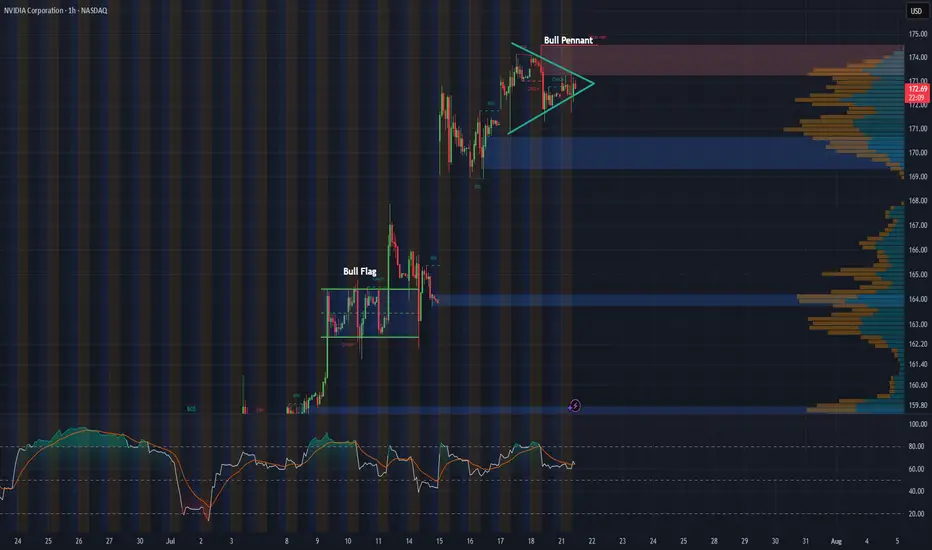
NVDA 1-Hour Chart UpdateHey everyone, just wanted to share a quick update on NVDA’s 1-hour chart. Following last week’s bull flag breakout, the stock appears to be consolidating into what looks like a solid bull pennant formation.
With major tech earnings on the horizon and the recent approval to sell H20 chips to China, this pattern could be setting the stage for another breakout. Will NVDA continue its impressive rally, or is this just a breather before the next move?
$NVDA WEEKLY TRADE IDEA – JULY 21, 2025
💥 NASDAQ:NVDA WEEKLY TRADE IDEA – JULY 21, 2025 💥
🔥 Bullish Options Flow + Weekly RSI Strength = Controlled Momentum Play
⸻
📊 Trade Details
🔹 Type: Long Call
🎯 Strike: $180.00
📆 Expiry: July 25, 2025 (4DTE)
💰 Entry: $0.51
🎯 Target: $1.02 (💯% Gain)
🛑 Stop: $0.20 (~40% Risk)
📈 Confidence: 65%
🕰️ Timing: Monday Open
📦 Size: 1 Contract (Adjust based on risk tolerance)
⸻
📈 Why This Trade?
✅ Call/Put Ratio = 1.48 → Bullish bias confirmed
📈 Weekly RSI = 77.0 → Strong momentum
🔻 Daily RSI = 80.8 (falling) → Short-term pullback risk
📉 Volume = flat (1.0x) → Weak confirmation = tighter risk mgmt
🧠 Strike Clustering: $177.50 & $180 = strong OI zones
🌬️ VIX = 16.7 → Favorable for long premium plays
⸻
⚠️ Risks & Strategy Notes
❗ Daily RSI = caution: short-term exhaustion possible
📉 Weak volume = lack of institutional chase
⏳ Exit before Friday – avoid IV crush and gamma slam
🔐 Set alerts at $178.75 and $179.80 – pre-breakout signals
⸻
🎯 Plan:
• Enter Monday open
• Scale partials if price hits +30–50%
• Full exit by Thursday unless price is breaking through $180 early with strong volume
⸻
🏁 Quick Verdict:
This is a momentum continuation setup, not a fresh breakout.
Play the trend, respect RSI signals, and cut fast if flow dries up.
NASDAQ:NVDA 180C — Risk $0.20 to Target $1.02
Let the call ride… just don’t overstay.
⸻
#NVDA #OptionsTrading #CallOption #WeeklyPlay #MomentumTrade #FlowBasedSetup #TradingViewIdeas #GammaPlay #BullishBias #NVIDIA

$NVDA Tradespoon – Long Entry $172.41Tradespoon model generated long signal for NASDAQ:NVDA . Predicted range: $172.41–$175.21. Trend: +0.65%. NASDAQ:NVDA
