BUY opportunity on NVDA (D1) daily chart using PVSRAUsing PVSRA, I have noticed that price is just touching the 233 EMA for possibly another push-up that will come soon in the next few days.
NVDA trade ideas

Be Cautious on NVDABe very careful on NVDA...
Double top already confirmed with neckline of "M" broken.
Mid term trends all confirmed down

2/28/25 - $nvda and tape in the month ahead (LONG READ)2/28/25 :: VROCKSTAR :: NASDAQ:NVDA
NASDAQ:NVDA and tape in the month ahead (LONG READ)
- wild day y'day
- but let's set our feet and think ahead
- first on nvda, and i'm choosing to post my portfolio/ allocation on this name bc it's an important one for mkt sentiment, risk, geopol etc.
NASDAQ:NVDA
5% LEAPS (2x leverage)
- majority of world still thinks AI is a meme and on this topic, it's not. your job is now a meme. these chips have such a moat and demand that incremental margin doesn't matter. you're getting 0.5x PEG and 3.5% fcf yield. we're at the value region, anything lower (toward $100) and i'm considering that despair/capitulation and i'll take the LEAPS to 10%.
NYSE:TSM
5% LEAPS (2x leverage)
- geopol punching bag. if you had to pick one between nvda and tsm i don't think you could do it. they're so different and with respective moats. also about 0.5x PEG and 4% fcf yield. we're in value territory and a move closer toward $150 and i'd consider 10% LEAP size.
*pause* why 2-1 leverage V? isn't that risky? yes, leverage risky, but i'm keeping these ITM and have a keen sense for valuation in a 2Y context and want to express this view while keeping cash higher and hence ability to maneuver.
*moving on*
NASDAQ:NXT
35% LEAPS (1.5x leverage)
- i've written extensively about this, but to the new crowd you check all boxes. a/ visibility for 1y of growth beats based on backlog and a sleeping consensus, b/ killer ROIC and cash generation, c/ cheap valuation (nearly 10% fcf yield on my #s, and still 7% on cons.), d/ buybacks coming on an underleveraged-cash-rich balance sheet in 2H and e/ the most important factor - an A+ CEO and leadership team
OTC:OBTC
20%
- closed end BTC fund trading 10% shy of NAV in last weeks, so way to get BTC exposure ("the king") at a discount in a rocky risk environment
- BTC remains a long duration beta, not yet getting the "wtf freak out" premium that gold has today (and probably bc it's not so well understood - that's cool - good to acknowledge it).
- goal is to stack sats, but diligently and carefully
- best to avoid leverage in the current environment
- would be a full position (i'd make it 30-40%) if/when BTC goes into high 60s or low 70s, otherwise I'm patient. BTC needs catalyst on monetary front to find new highs.
NYSE:UBER
7.5% LEAPS (2x leverage)
- another one i've written about extensively, so check out details
- tl;dr is a/ orthogonal to any foreign content/ tariff BS, b/ great leadership team fwd thinking and on the forefront of AV (autonomous) despite the consensus that's wait and see, c/ growing margins, great returns and tremendous cash generation, d/ 6% fcf yield and sticky safe haven in this tape limit draw down risk, e/ multi-year compounder set and forget at current rate
*honorable mentions*
- names that i trade around, usually high frequency in/out, would perhaps consider larger positions if/when tape behaves. right now i'm only parking in stuff i a/ know really well, b/ see great value for participating and therefore c/ can size them reasonably large. i don't like having a complicated and smorgasbord of names in this tape.
NASDAQ:NICE - cheapest B2B software moving the AI needle into their customers w good growth, high cash gen and heavy buyback incoming
$DECK/ NYSE:YETI - the only two discretionary names (in a tough consumer) that are on my high watchlist given growth/ cash generation and combination of the two. tricky. needs to be managed carefully in this consumer-eat-dirt environment.
NASDAQ:MU / NASDAQ:ALAB - the two semis I think are interesting ex- NYSE:TSM and $NVDA. NASDAQ:MU for HBM being a key grower inside inference applications and probably massively understated on my math and NASDAQ:ALAB bc they're able to offer some crazy performance benefits and the #s are outstanding w/ cash gen following.
NASDAQ:BLDE - the only investable EVTOL business. the NASDAQ:TMDX result was a "pass" and limited my ST interest here. I'd consider Blade to be a price inelastic Uber with no relevant competition. I'd also think Uber eventually buys these guys.
Hope that helps inform my thinking (as I'm sure I'd get a lot of DMs today) and wanted to spell it all out if you can incorporate into your mosaic/ own PnL.
I'd guess we're most of the way thru this sell-off despite what ______ is saying, mainly b/c we've had an asynchronous dip (so it's hard to notice) and each name has taken it's turn doing the -15% to -50% dump in the last 6-12 months (and especially many recently). The index isn't showing it b/c CBOE:SVIX has been the stealth QE/ pins, but I digress. More for another day.
If you're reading this, you woke up today.
So you started with a big W.
Showing up with a positive attitude is a competitive advantage. Don't let that one go. You got this.
Lock in.
V

enough needed to be said...
Probably a safe bet to go on a long term short position now. NVDA needed a catalyst and Deepseek was the catalyst.

NVDA Near Key Support – Will the Bounce Hold? Feb. 28Market Structure Overview
NVDA has been in a strong downtrend, forming a descending wedge pattern. The stock is currently hovering around a key support zone near $120, with increasing sell volume. A breakdown could lead to further downside, while a reversal from this level could spark a short-term rally.
Key Support & Resistance Levels
* Support: $120, $118, and $115 (GEX Negative Zone)
* Resistance: $129, $136, and $143 (GEX Call Wall)
* Major Gamma Exposure Levels:
* CALL Resistance: $140, $145, $150
* PUT Support: $120, $118, $115
Indicators & Momentum
* MACD: Bearish, but showing early signs of a potential crossover.
* Stochastic RSI: Deeply oversold, signaling a potential bounce.
* Volume: Elevated selling pressure with a possible exhaustion phase.
GEX Analysis & Options Flow
* IVR: 47 (moderate implied volatility)
* Options Sentiment: CALLs at 13.7%, indicating bearish sentiment in the near term.
* GEX Levels: Highest negative NETGEX support at $120, suggesting a possible bounce zone if demand returns.
Trade Plan: Scenarios to Watch
1. Bullish Scenario: If NVDA holds above $120 and breaks $129, a reversal towards $136-$140 is possible.
* Entry: Above $129
* Target: $136, then $143
* Stop Loss: Below $118
2. Bearish Scenario: A breakdown below $120 could trigger a move to $115 or even $110.
* Entry: Below $120
* Target: $115, then $110
* Stop Loss: Above $125
Final Thoughts
NVDA is at a pivotal point. If it holds above $120, bulls might regain control. However, failure to sustain above this level could bring more downside. Watch for a volume increase to confirm direction.
📌 Disclaimer: This analysis is for educational purposes only. Always do your own research and trade responsibly!

NVDA - Completed 3 wave corrective pattern, upside to come?NASDAQ:NVDA is looking at a potential rebound after completing its 3-wave structure as prices saw a sustained rebound at 117 region, which coincide with the 138.2% Fib expansion level of wave A-B. Right now, upside seems to be an corrective upside and may hit 135-148 region before hitting a resistance.

NVDA - where to buy (1D time frame analysis)hi traders,
It looks like bears are in control.
However, I can see a potential set-up to play the bounce.
The recommended strategy for bulls:
- entry price: 115$ looks like a good level to long.
- Tight stop loss at 112$
- Target: 128$,
Risk-reward ratio: 5,01
Good luck

The key is whether there is support around 121.82-123.90
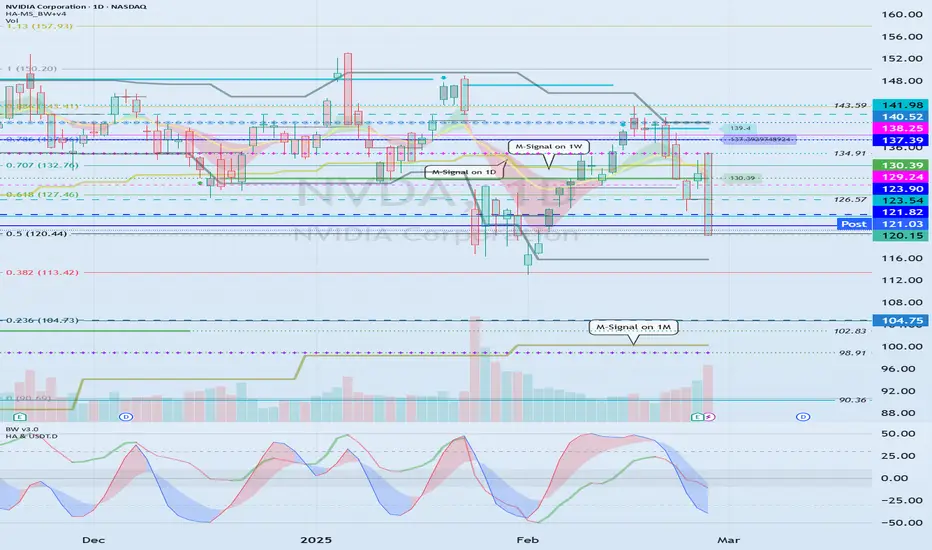
Hello, traders.
If you "Follow", you can always get new information quickly.
Please also click "Boost".
Have a nice day today.
-------------------------------------
(NVDA 1W chart)
The key is whether it can receive support and rise around the Fibonacci ratio range of 0.5 (120.14) ~ 0.618 (127.46).
If not, and it falls, it is expected to touch the M-Signal indicator on the 1M chart.
Accordingly, there is a possibility that it will touch around 104.75.
-
(1D chart)
The key is whether it can rise above 121.82-123.90 and receive support.
If not,
1st: Fibonacci ratio 0.382 (113.42)
2nd: 104.75
You need to check whether it is supported near the 1st and 2nd above.
At this time, the important thing is whether the price can be maintained above the M-Signal indicator of the 1M chart.
If it falls below the M-Signal indicator of the 1M chart and remains, it is likely to turn into a downtrend, so be careful when trading.
-
Thank you for reading to the end.
I hope you have a successful trade.
--------------------------------------------------
NVIDIA - Sell off continues.So same plan as mentioned, Nvidia has to do its retracement before being able to gain more for a new ath.

I think this looks logica. Am I crazy?NASDAQ:NVDA has always recovered strong after the earnings dip. I think the sell off has come to the end and the pump to $160 is ready

Nvidia stumbles to test 200 MA post earningsWill the dip buyers emerge here?
US markets continue to remain on the back foot, with the tech sector in sharp focus after Nvidia’s earnings. The chip giant initially climbed over 1% in pre-market trading but swiftly reversed, dropping 4% as investors reacted to results that, while decent, failed to dazzle. With chipmakers driving market volatility and concerns mounting over US-China tech tensions, Nvidia’s performance today could set the tone for the sector.
Adding to uncertainty, Donald Trump reignited trade war fears, announcing that tariffs on Mexico, Canada, and China will take effect on 4 March.
Let's see if Nvidia dip-buyers will emerge to defend the 200-day MA around $126 area, or whether we will see further weakness heading into the close. Next key levels to watch include $120.00 and $115.00. Wednesday's low of $128.50 is now the key resistance level to watch. It would be a bullish scenario if we go back above this level now.
On a macro front, attention turns to Friday’s Core PCE data following weak economic reports, including a 4.6% slump in pending home sales and rising jobless claims. Next week we have ISM PMIs and NFP jobs report, as well as a rate decision from the ECB, all to look forward to.
By Fawad Razaqzada, market analyst with FOREX.com

NVDA : Good shopping pointshello friends
We have analyzed these stocks for you in a very simple way. In the long term...
We have identified good shopping points where you can shop.
Note that the price is at the ceiling of the channel and it is not logical to buy at the ceiling of the channel, so either we buy in case of correction or if the channel is broken and its failure is valid, we can buy.
*Trade safely with us*

AI is not a bubbleNVIDIA reported earnings of 89 cents per share on revenue of $39.33 B for Q4. While revenue grew 77.94% on a year-over-year basis. The consensus earnings estimate was 84 cents per share on revenue of $37.72 B. The company said it expects Q1 revenue of $42.14 B to $43.86 B, and gross margins of 70.5% to 71.5%, which calculates to non-GAAP earnings of 89 cents to 97 per share.
Long trade idea:
long = 130
stop = 125
profit = 160
NVDA options data:
3/21 expiry
Put Volume Total 159,655
Call Volume Total 331,044
Put/Call Volume Ratio 0.48
Put Open Interest Total 1,957,392
Call Open Interest Total 2,368,522
Put/Call Open Interest Ratio 0.83
4/17 expiry
Put Volume Total 125,626
Call Volume Total 81,625
Put/Call Volume Ratio 1.54
Put Open Interest Total 521,463
Call Open Interest Total 712,523
Put/Call Open Interest Ratio 0.73
5/16 expiry
Put Volume Total 32,339
Call Volume Total 49,339
Put/Call Volume Ratio 0.66
Put Open Interest Total 366,100
Call Open Interest Total 389,827
Put/Call Open Interest Ratio 0.94

Nvidia Flexes Bold Guidance but Can the Chipmaker Deliver on It?Chief Jensen Huang showed hubris on the earnings call right after Nvidia NVDA reported another blockbuster quarter with record sales and soaring profits. He said that demand for the new Blackwell chip is “amazing.”
“Well, I'm more enthusiastic today than I was at CES We have some 350 plants manufacturing the 1.5 million components that go into each one of the Blackwell racks, Grace Blackwell racks. Yes, it's extremely complicated,” Huang said. “Nothing is easy about what we’re doing, but we’re doing great.”
Everyone and their dog was glued to the screen after-hours Wednesday, waiting to hear what the most important person for the stock market was going to say. And many were hoping it’ll be good and Nvidia will save us from the recent selloff that spilled from tech stocks to all stocks .
And indeed, it was another stellar performance by Nvidia. For the fourth quarter ended January 26, the chipmaking giant pulled in record revenue of $39.3 billion, up 80% from a year ago, topping analyst estimates for $38 billion. Earnings per share reached $0.89 against Wall Street guidance for $0.84 a pop. Net income landed at $22.1 billion, up 80% from a year earlier.
Without a doubt, Nvidia continued its string of record-shattering results. And, what’s more, that’s also what Nvidia thinks will happen with the current quarter. The company projected revenue of $43 billion for the first three months of 2025, up 65% from the year-ago quarter when sales hit $26 billion .
To get to that figure, and keep the growth going, Nvidia will need to retain all its deep-pocketed clients like Amazon AMZN , Meta META , Microsoft MSFT and Alphabet GOOGL . These four alone make up about half of Nvidia’s revenue. Other customers with buckets of cash include ChatGPT parent OpenAI and Elon Musk’s Tesla TSLA .
As to the share price, investors didn’t really cheer the upbeat guidance or the double beat on both earnings and revenue. The stock showed virtually no reaction in extended trading — could it be that markets expected an even bigger blowout performance?
Or maybe they don’t believe in Nvidia’s business model after DeepSeek achieved for mere millions what OpenAI achieved for hundreds of millions? Year to date, Nvidia, the second-largest company in the world , is down 5% to $3.2 trillion. It’s drifted about 10% away from the all-time high hit in early January.
And with this, make sure to closely watch the earnings calendar for other hot reports as AI history is being made before our eyes.
What’s your take on Nvidia’s future? Do you think its Big Tech clients will soon whip up their own AI chips? Or is Nvidia’s AI dominance set in stone? Share your thoughts in the comment section!

NVIDIA's Momentum Analysis: Strong Fundamentals & TechnicalsUnpacking NVIDIA's powerful Q4 2025 performance with record revenue of $39.3B (up 78% YoY) and explosive Data Center growth of 93%. Technical analysis reveals strong support at the 50-day MA ($130-$134) with resistance at the all-time high ($153.13). Recent price action shows bullish momentum with key technical indicators pointing to continued strength. Essential viewing for investors navigating NVIDIA's post-earnings trajectory.

NVDA: Buying opportunityAs you can see on NVDA we have a great buying opportunity according to the chart setup.

Breaking: Nvidia ($NVDA) Surges 4% on Earnings BeatNvidia (NASDAQ: NASDAQ:NVDA ), the U.S.-based semiconductor giant, has once again outperformed market expectations, reporting $39.3 billion in Q4 revenue, a 2.7% increase beyond analyst projections. While its dominance in AI chips remains unchallenged, a surprising growth driver has emerged: its automotive and robotics segment. With demand for driver-assist technology soaring, this segment is poised to become Nvidia’s next multi-billion-dollar business.
The Rise of Nvidia’s Automotive Business
Nvidia’s automotive and robotics revenue surged by 103% year-on-year, reaching a record $570 million in Q4 FY2025. This brings its total segment revenue for the fiscal year to $1.69 billion, marking the second consecutive year above the $1 billion threshold.
Although automotive contributes just 1.45% to Nvidia’s total revenue, analysts predict exponential expansion as real-world applications of autonomous driving and robotics continue to develop.
Technical Analysis
As of the latest session, NASDAQ:NVDA closed up 3.67% and continued its positive momentum, rising 2% in premarket trading. From a technical standpoint, Nvidia is approaching a bullish breakout, supported by the following indicators:
- RSI at 48: This suggests the stock is neither overbought nor oversold, leaving ample room for an upward push.
- Key Fibonacci Levels: In case of a pullback, the 65% Fibonacci retracement level serves as a strong support zone, providing a potential rebound point.
- Breakout Potential: A move above the 1-month high could signal further bullish momentum, paving the way for new highs.
With AI-driven demand surging, and Nvidia's automotive and robotics division gaining traction, the company is well-positioned for long-term profitability. Investors should keep a close watch on technical breakouts and fundamental milestones, as Nvidia continues to redefine the future of AI and autonomous technology.

$NVDA Sideways Since Sept '24NASDAQ:NVDA stock has been trading sideways nearly six months, through multiple earnings. Also, seeing lower highs in 2025. What catalysts remain?

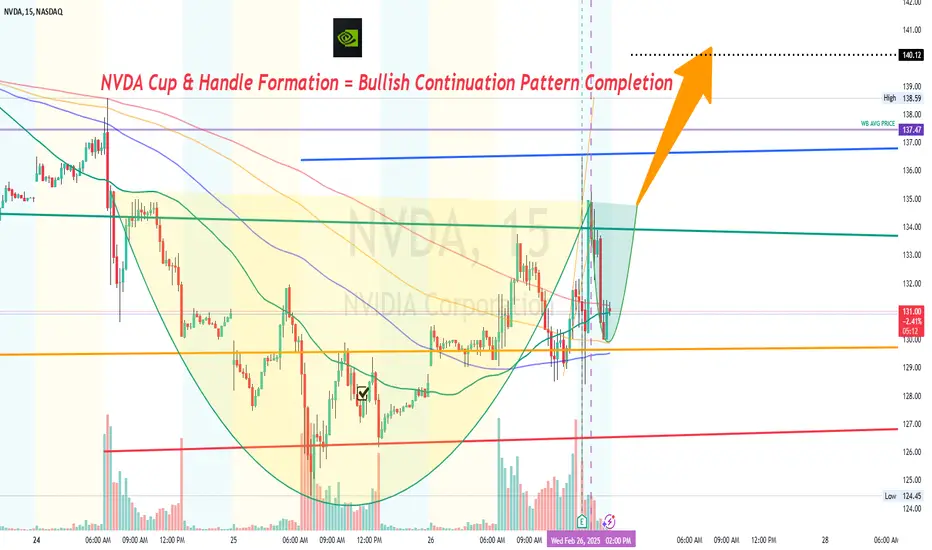
NVDA Cup & Handle FormationNVDA Cup & Handle Formation = Bullish Continuation Pattern Completion
Target Projected for Thursday Feb 27 Closing Candle/Price = $140.12
Updates:
Nvidia (NVDA) Share Price Dips Slightly After Earnings ReportNvidia (NVDA) Share Price Dips Slightly After Earnings Report
Following the close of the main trading session yesterday, Nvidia released its quarterly earnings report, exceeding analysts' expectations:
→ Earnings per share: Actual = $0.89, Expected = $0.84
→ Revenue: Actual = $39.3 billion, Expected = $38.1 billion (a 78% increase year-on-year)
It was also revealed that Nvidia’s latest AI chip family, Blackwell, generated $11 billion in sales for the quarter. This eased concerns that transitioning to the Blackwell chip series could lead to a decline in revenue.
How Nvidia (NVDA) Shares Reacted to the Earnings Report
Despite the strong earnings, Nvidia’s share price did not benefit significantly. Post-market trading saw heightened volatility, with NVDA shares fluctuating between $126 and $136 in the first few minutes after the report’s release.
As volatility subsided, NVDA stabilised around $129, slightly below Wednesday’s closing price of $131.37, reflecting a decline of approximately 1.7%.
Technical Analysis of NVDA Stock Chart
In February, NVDA’s share price continued to hold below the lower boundary of its previous upward trend channel after failing to break the psychological barrier at $150. Specifically:
→ The lower channel boundary has now acted as resistance (indicated by the arrow).
→ A downward trend channel (marked in red) is becoming increasingly apparent.
As a result, NVDA shares have not shown the ability to recover from the panic sell-off on 27 January, when Nvidia and other leading AI companies saw their stocks plummet following the success of Chinese startup DeepSeek.
NVDA Share Price Forecast
Analysts remain optimistic, possibly due to the expected increase in AI-related capital expenditure by major tech firms in 2025. Additionally, the upcoming GTC conference could serve as a bullish catalyst, likely featuring new product announcements within the Blackwell family.
According to TipRanks:
→ 33 out of 36 analysts recommend buying NVDA shares.
→ The 12-month average price target for NVDA is $177.
Trade on TradingView with FXOpen. Consider opening an account and access over 700 markets with tight spreads from 0.0 pips and low commissions from $1.50 per lot.
This article represents the opinion of the Companies operating under the FXOpen brand only. It is not to be construed as an offer, solicitation, or recommendation with respect to products and services provided by the Companies operating under the FXOpen brand, nor is it to be considered financial advice.

NVDA XABCD Best Level to BUY/HOLD 30% gains🔸Hello traders, today let's review recent price chart for NVDA.
Well defined swings in progress, expecting further downside before
the tide finally turns for NVDA bulls. Currently it's recommended to stay out.
🔸Speculative XABCD defined by points: X 150, A 115, B 140, C 120, D 160.
most points validated already, C/D pending.
🔸Well defined swings in progress, so expecting a low near 120 before
reversal and new swing higher.
🔸Recommended strategy bulls: Bulls wait for correction to complete at/near 129 usd in March 2025 and get ready to BUY/HOLD low, this is a swing trade setup, so will take longer to hit target, patience required. final TP is 160 USD, 30% upside from point C/buy entry. good luck traders!
🎁Please hit the like button and
🎁Leave a comment to support our team!
RISK DISCLAIMER:
Trading Futures , Forex, CFDs and Stocks involves a risk of loss.
Please consider carefully if such trading is appropriate for you.
Past performance is not indicative of future results.
Always limit your leverage and use tight stop loss.

Chart Pattern Analysis of NVDA
K4 break up the previous high price and close upon the resistance.
It is a bull signal for the market.
But there is still a concern about the lower demands along the recent candles.
Perhaps K4 is a fake up candle.
If that is a fact,
K5 will not likely create a higher high and usually will break down the resistant immediately.
Considered K5 is near the support along the uptrend channel,
The market will choose to break up or fall down here.
If K5 break up K4,
It will be a good place to buy then.
If K5 close below the resistance,
The consolidation will expand down to test 116USD.
It will be another good place to buy then.

Nvidia after earningschances are high for a retracement, since the stock shows not much of buying pressure.
My analysis is based on experience not facts.
