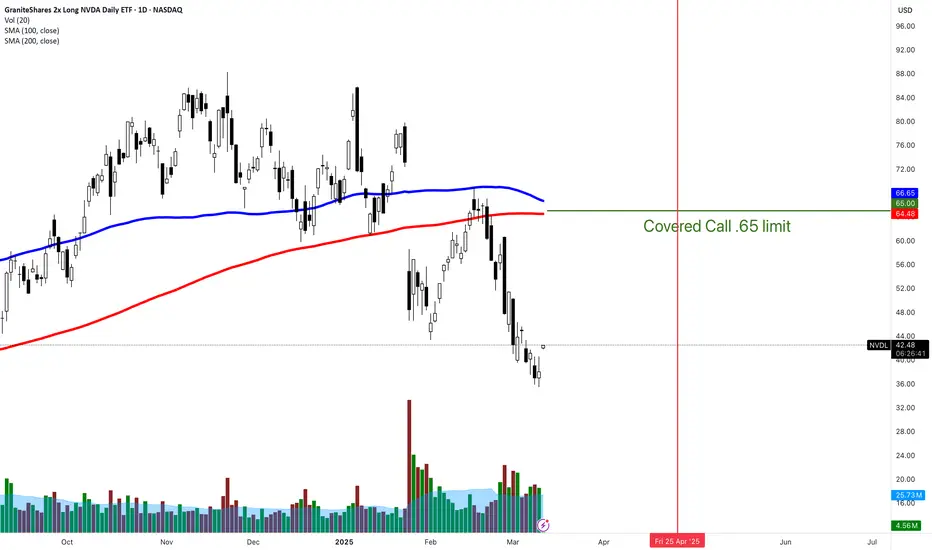
NVDL covered callsI have a few thousand shares. And selling here would create a profit for me. :-) So, I am figured, 3 STRONG up days? NVDA has earnings. And If I sell here, what a nice profit that would be!
Key stats
About GraniteShares 2x Long NVDA Daily ETF
Home page
Inception date
Dec 13, 2022
Structure
Open-Ended Fund
Replication method
Synthetic
Dividend treatment
Distributes
Distribution tax treatment
Ordinary income
Income tax type
Capital Gains
Max ST capital gains rate
39.60%
Max LT capital gains rate
20.00%
Primary advisor
GraniteShares Advisors LLC
Distributor
ALPS Distributors, Inc.
NVDL is a short-term tactical tool that aims to deliver 2x the price return, less fees and expenses, for a single day of NVIDIA stock. Purchasers holding shares for longer than a day need to monitor and frequently rebalance their position to attempt to achieve the 2x multiple. At the adviser's discretion, the fund may utilize standardized exchange-traded and FLEX call and put options with 1-week to 1-month terms. It may either buy deep in-the-money calls or use a synthetic forward options strategy. Aside from the leverage, the shares take on added volatility due to the lack of diversification.Purchasers should conduct their own stock research prior to initiating a position and trade with conviction. Due to the complexities of the product shares tend to perform as anticipated only when underlying shares are trending and holders are on the positive corresponding side of that trade. However, the shares provide the advantage of capping the maximum loss to the full amount invested.
Related funds
Classification
What's in the fund
Exposure type
Cash
Bonds, Cash & Other100.00%
Cash100.00%
Top 10 holdings

NVDL covered callBuy low, sell high? Great premium. NOT that much time really..? Strong resistance. I'll hold this one until expiration because I really wouldn't mind selling at $65
Covered call on NVDL DOING IT AGAIN. I have some shares. If you do not, looks like a great place to buy!
Buy low, sell high
THIS IS over NVDA earnings. But if I can buy to close this sold call for 50% premium capture in the next 2 weeks I will. Otherwise, I would not be upset about selling this stock at $80 for a NIC

NVDLNVDA has had some serious pullbacks and the fundamentals are all intact. These trade levels are for a swing trader to take advantage of the possible scenario of a run into earnings.
Green are load zones
Yellow is start of Sell zones
Red is top.
Not Financial Advice.

New ways of looking at charts Playing with flat top flat bottom indicator to find support resistance and trendlines . Looking at btc with a new pair of eyes while using this tool for the first time. It is easy to spot now of course but is the confluence of price action indicators and market sentiment that make it work .... as l

NVDL covered callThis option is about $4.00 right now. Nice bounce off of the 100/200 SMA. Some "trump" news with Ai and 500B coming into that market is allowing NVDA to slowly creep higher.
Buy low, sell high, right!?

NVDA Multi-Asset Income StrategyRecently, I've been looking a lot at Yield Max ETFs and other options-based yield ETFS more generally such as QDTE, XDTE, RDTE, QQQI, SPYI, YQQQ (inverse), etc.
One possible way to outperform SPY & QQQ, may be to consider investing in such ETFs, though this is purely theoretical s tradingview does

NVDL covered callI like this sideways movement. AND I like the Theta days on this option sale.
:=-)
And if I sell here, that would be a nice profit! Buy low, sell high

NVDL:ABCD patternNVDL:
-ABCD pattern.
-Fibo retracement at golden zone.
-Key level support.
-Demand zone support.
.
See more plans on US STOCKS- WALL STREET DREAM

NVDL covered callOverall bull trend. Earnings came out on NVDA. They did "great".
This covered call is over thanksgivings and the theta burn should be nice. BUT, this also represents a $13 stock increase, which would be sick. I have no issue selling here at this profit level. STRONG chance I can buy to close this s

See all ideas
Summarizing what the indicators are suggesting.
Oscillators
Neutral
SellBuy
Strong sellStrong buy
Strong sellSellNeutralBuyStrong buy
Oscillators
Neutral
SellBuy
Strong sellStrong buy
Strong sellSellNeutralBuyStrong buy
Summary
Neutral
SellBuy
Strong sellStrong buy
Strong sellSellNeutralBuyStrong buy
Summary
Neutral
SellBuy
Strong sellStrong buy
Strong sellSellNeutralBuyStrong buy
Summary
Neutral
SellBuy
Strong sellStrong buy
Strong sellSellNeutralBuyStrong buy
Moving Averages
Neutral
SellBuy
Strong sellStrong buy
Strong sellSellNeutralBuyStrong buy
Moving Averages
Neutral
SellBuy
Strong sellStrong buy
Strong sellSellNeutralBuyStrong buy
Displays a symbol's price movements over previous years to identify recurring trends.
Frequently Asked Questions
An exchange-traded fund (ETF) is a collection of assets (stocks, bonds, commodities, etc.) that track an underlying index and can be bought on an exchange like individual stocks.
NVDL trades at 83.62 USD today, its price has fallen −4.93% in the past 24 hours. Track more dynamics on NVDL price chart.
NVDL net asset value is 83.80 today — it's risen 26.38% over the past month. NAV represents the total value of the fund's assets less liabilities and serves as a gauge of the fund's performance.
NVDL assets under management is 4.51 B USD. AUM is an important metric as it reflects the fund's size and can serve as a gauge of how successful the fund is in attracting investors, which, in its turn, can influence decision-making.
NVDL price has risen by 26.70% over the last month, and its yearly performance shows a 40.14% increase. See more dynamics on NVDL price chart.
NAV returns, another gauge of an ETF dynamics, have risen by 26.38% over the last month, showed a 118.00% increase in three-month performance and has increased by 41.65% in a year.
NAV returns, another gauge of an ETF dynamics, have risen by 26.38% over the last month, showed a 118.00% increase in three-month performance and has increased by 41.65% in a year.
NVDL fund flows account for −1.53 B USD (1 year). Many traders use this metric to get insight into investors' sentiment and evaluate whether it's time to buy or sell the fund.
Since ETFs work like an individual stock, they can be bought and sold on exchanges (e.g. NASDAQ, NYSE, EURONEXT). As it happens with stocks, you need to select a brokerage to access trading. Explore our list of available brokers to find the one to help execute your strategies. Don't forget to do your research before getting to trading. Explore ETFs metrics in our ETF screener to find a reliable opportunity.
NVDL invests in cash. See more details in our Analysis section.
NVDL expense ratio is 1.06%. It's an important metric for helping traders understand the fund's operating costs relative to assets and how expensive it would be to hold the fund.
Yes, NVDL is a leveraged ETF, meaning it uses borrowings or financial derivatives to magnify the performance of the underlying assets or index it follows.
In some ways, ETFs are safe investments, but in a broader sense, they're not safer than any other asset, so it's crucial to analyze a fund before investing. But if your research gives a vague answer, you can always refer to technical analysis.
Today, NVDL technical analysis shows the buy rating and its 1-week rating is buy. Since market conditions are prone to changes, it's worth looking a bit further into the future — according to the 1-month rating NVDL shows the buy signal. See more of NVDL technicals for a more comprehensive analysis.
Today, NVDL technical analysis shows the buy rating and its 1-week rating is buy. Since market conditions are prone to changes, it's worth looking a bit further into the future — according to the 1-month rating NVDL shows the buy signal. See more of NVDL technicals for a more comprehensive analysis.
NVDL trades at a premium (0.21%).
Premium/discount to NAV expresses the difference between the ETF’s price and its NAV value. A positive percentage indicates a premium, meaning the ETF trades at a higher price than the calculated NAV. Conversely, a negative percentage indicates a discount, suggesting the ETF trades at a lower price than NAV.
Premium/discount to NAV expresses the difference between the ETF’s price and its NAV value. A positive percentage indicates a premium, meaning the ETF trades at a higher price than the calculated NAV. Conversely, a negative percentage indicates a discount, suggesting the ETF trades at a lower price than NAV.
NVDL shares are issued by GraniteShares, Inc.
NVDL follows the No Underlying Index. ETFs usually track some benchmark seeking to replicate its performance and guide asset selection and objectives.
The fund started trading on Dec 13, 2022.
The fund's management style is active, aiming to outperform its benchmark index by actively selecting and adjusting assets. The goal is to achieve returns that exceed those of the index the fund tracks.