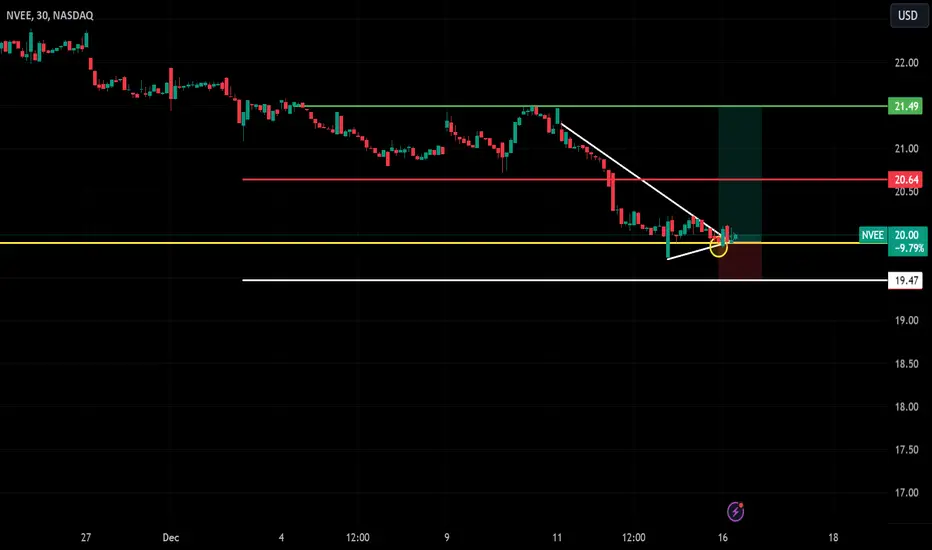
NVEE Trendline Breakout with Upside Potential !NVEE on the 30-minute chart shows a breakout above the descending trendline, signaling a potential reversal and bullish momentum.
Entry: $19.99
Stop-Loss: $19.47
Target 1 (T1): $20.64
Target 2 (T2): $21.49
The price action is supported by a trendline break and consolidation near the support zone. A clear risk-to-reward setup with tight stop-loss and profit targets in place.
⚠️ Watch for increased volume to confirm the breakout.
#NVEE #NASDAQ #Breakout #TechnicalAnalysis #TradingSetup #SwingTrading #RiskManagement #TrendlineBreak #TradingView 🚀
NVEE trade ideas
NVEE - 17 months DESCENDING TRIANGLE══════════════════════════════
Since 2014, my markets approach is to spot
trading opportunities based solely on the
development of
CLASSICAL CHART PATTERNS
🤝Let’s learn and grow together 🤝
══════════════════════════════
Hello Traders ✌
After a careful consideration I came to the conclusion that:
- it is crucial to be quick in alerting you with all the opportunities I spot and often I don't post a good pattern because I don't have the opportunity to write down a proper didactical comment;
- since my parameters to identify a Classical Pattern and its scenario are very well defined, many of my comments were and would be redundant;
- the information that I think is important is very simple and can easily be understood just by looking at charts;
For these reasons and hoping to give you a better help, I decided to write comments only when something very specific or interesting shows up, otherwise all the information is shown on the chart.
Thank you all for your support
🔎🔎🔎 ALWAYS REMEMBER
"A pattern IS NOT a Pattern until the breakout is completed. Before that moment it is just a bunch of colorful candlesticks on a chart of your watchlist"
═════════════════════════════
⚠ DISCLAIMER ⚠
Breakout Area, Target, Levels, each line drawn on this chart and any other content represent just The Art Of Charting’s personal opinion and it is posted purely for educational purposes. Therefore it must not be taken as a direct or indirect investing recommendations or advices. Entry Point, Initial Stop Loss and Targets depend on your personal and unique Trading Plan Tactics and Money Management rules, Any action taken upon these information is at your own risk.
═════════════════════════════

TOP US-Stocks: Buy-Signal NVEEThe stock just broke through a perfect buy point and triggered a buy-signal. The stop loss level and profit target are shown in the graphic.
All stocks on our watchlists meet the hard selection criteria according to Mark Minervini's Trend-Template and William o' Neil's CAN SLIM methodology AND
are in the process of developing a Perfect Buy Point and a low-risk entry, following a volatility contraction pattern.
The stock just broke through a perfect buy point and triggered a buy-signal. The stop loss level and profit target are shown in the graphic.
🍾🍾 We trade like the Champions 🍾🍾
Are you struggling with your trading strategy? Follow me to get free, real-time trading signals which are all based on Mark Minervini's success-proven strategy.

NV5 Announces $100 Million Share Repurchase ProgramNVEE: NV5 Global, Inc.
2022-08-29 08:00:37 NV5 Announces $100 Million Share Repurchase Program

NV5 Awarded $8 Million Contract Expansion by Southwest UtilityNVEE: NV5 Global, Inc.
2022-08-09 08:00:00 NV5 Awarded $8 Million Contract Expansion by Southwest Utility

$NVEE Bullish candle with high volume targeting 138-140Best entry if its falls to 116 -115 to close previous gap then targeting 138-140 or higher

NVEE: CUP AND HANDLE BREAKOUT WATCHNvee :
Cup and handle.
Long above 108.5.
Stop below breakou t candle.
Target on the chart.
Trade safe!

CONNCONN: Conn's, Inc.
2021-12-15 06:00:00
Conn’s Announces Authorization of $150 Million Share Repurchase Program

NV5 Awarded $15 Million Infrastructure Engineering Design ContraNVEE: NV5 Global, Inc.
2021-12-15 08:00:00
NV5 Awarded $15 Million Infrastructure Engineering Design Contract by New York City Department of Design and Construction

NV5 Awarded $6 Million Transportation Infrastructure Contract byNVEE: NV5 Global, Inc.
2021-06-21 08:00:00
NV5 Awarded $6 Million Transportation Infrastructure Contract by City of Fresno

NV5 Awarded $7 Million LNG Loading System Contract by Southeast NVEE: NV5 Global, Inc.
2021-05-10 08:00:00
NV5 Awarded $7 Million LNG Loading System Contract by Southeast Utility

NV5 Awarded $50 Million REI Inspection Contract in New York CityNVEE: NV5 Global, Inc.
2021-04-26 08:00:00
NV5 Awarded $50 Million REI Inspection Contract in New York City

NV5 Awarded $6.6 Million Geospatial Contract by Investor-Owned UNVEE: NV5 Global, Inc.
2021-03-08 08:00:00
NV5 Awarded $6.6 Million Geospatial Contract by Investor-Owned Utility

NV5 Awarded $5 Million in South Florida Program Management and INVEE: NV5 Global, Inc.
2021-02-02 08:00:00
NV5 Awarded $5 Million in South Florida Program Management and Inspection Contracts

$NVEEEntry price : 75.13
Fundamentals :
- Sector: Busins Svc
- EPS % Chg (Last Qtr): 40%
- 3 Year EPS Growth Rate: 14%
- EPS Est % Chg (Current Yr): 16%
- Sales % Chg (Last Qtr): 30%
- 3-Year Sales Growth Rate: 26%
- Annual Pre -Tax Margin: 10.0%

NV5 Awarded $13 Million in North Carolina Department of TransporNVEE: NV5 Global, Inc.
2020-12-14 08:00:00
NV5 Awarded $13 Million in North Carolina Department of Transportation Contracts

NV5 Awarded $16 Million in North Carolina Department of TransporNVEE: NV5 Global, Inc.
2020-10-22 08:00:10
NV5 Awarded $16 Million in North Carolina Department of Transportation Contracts

NV5 Awarded $4 Million USGS Lidar Survey Contract in Montana!!!NVEE: NV5 Global, Inc.
2020-10-12 08:00:10
NV5 Awarded $4 Million USGS Lidar Survey Contract in Montana

NV5 Awarded $12 Million Program Management Contract by Caltrans!NVEE: NV5 Global, Inc.
2020-06-29 08:00:10
NV5 Awarded $12 Million Program Management Contract by Caltrans

NV5 Announces $6 Million Contract for Environmental Inspection oNVEE: NV5 Global, Inc.
2020-01-30 08:00:10
NV5 Announces $6 Million Contract for Environmental Inspection of Natural Gas Pipeline Infrastructure

NV5 Awarded $20 Million Contract for Design of Underground PowerNVEE: NV5 Global, Inc.
2020-01-16 08:00:10
NV5 Awarded $20 Million Contract for Design of Underground Power Lines

NV5 Awarded $12 Million in Airport Expansion ContractsNVEE: NV5 Global, Inc.
2019-10-03 08:00:00
NV5 Awarded $12 Million in Airport Expansion Contracts

NVEE buying for the LONG (2+ years)Buying ~73.49. Selling at red line.
My fair value for this company is $82 per share.
