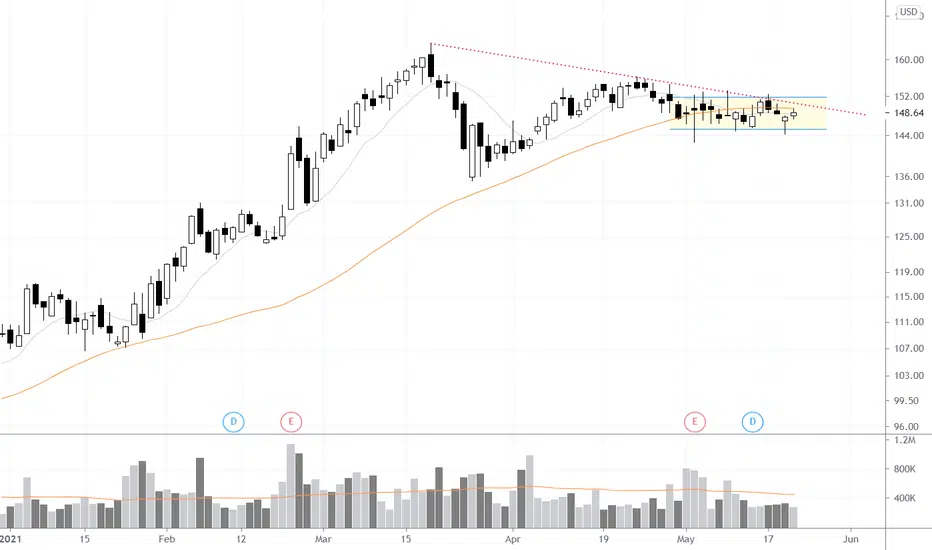
NXST Buy IdeaGood P/L ratio. Fairy valued.
Analytic Rating is Best Buy.
There was a buy signal a couple of weeks ago, and now we have a pullback. Good entry point
Not an investment recommendation
Next report date
—
Report period
—
EPS estimate
—
Revenue estimate
—
20.62 USD
702.00 M USD
5.41 B USD
28.20 M
About Nexstar Media Group, Inc.
Sector
Industry
CEO
Perry A. Sook
Website
Headquarters
Irving
Founded
1996
FIGI
BBG000DZJVH0
Nexstar Media Group, Inc. is a television broadcasting and digital media company, which engages in the acquisition, development, and operation of television stations and interactive community websites and digital media services. The firm offers services free over-the-air programming which includes programs produced by networks with which the stations are affiliated, programs that the stations produce, and first-run and rerun syndicated programs that the stations acquire. It also provides digital publishing and content management platforms to media publishers and advertisers. The company was founded by Perry A. Sook in 1996 and is headquartered in Irving, TX.
Related stocks

NYSE - SwingTrading: Buy Signal NXSTThe stock NXST on our watchlist crossed a low risk enty point and generated a buy signal, we have added the stock to the JS-TechTrading portfolio.
SL is less than 5.3% (SL at 163.3), win target is > 11%.
NXST has a high relative strentgh (IBD style) and broke out of a volatility contraction pattern

NXST wants to test $200NXST may soon be ready to test $200 levels. closed near the highs after a small shakeout. nice volume and volatility contraction.
BUY above 191.15.
GOOD LUCK!

$NXST: COVID / Tech Hangover?This one may be a bit risky but valuations are below the historical average and there's is some possibility that the divisions we've been seeing over COVID vaccines leads to a more local-focused population. People getting back to what's real and the issues that actually affect them in order to recal

Communications is Key: ExpandedIf riding one of the communications stocks (I dont much like XLC as an investment, good benchmark tho) like NXST I would just keep riding here, tho I would not be looking for an entry here unless the FED creates an opening for us.

NXST offering a pocket pivot entry* Okay earnings
* Steady up trend
* High RS in the Communication Services sector
* Trading in a tight range for the past ~9 months
* Last couple of days picking up high volume
Notes:
* This is still trading n a range so be careful. It may continue trading in this range.
* Pocket pivots indicate t

$NXST: Will Recent Broadcasting Woes Subside?Along with $SBGI, $FOX, $NWSA and $GTN companies have seen broad based weakness in view ship. Will the trend continue and lead these lower? We'll see!

NXST Text Book VCP pattern NXST has been coiling tighter and tighter and is looking ready to breakout, not the biggest dry up of volume on the daily but there is some in the weekly chart
Planned entries are at the two red lines

NXST formed a perfect pennant pattern and is about to break outNASDAQ:NXST is posting impressive earnings and has formed a perfect pennant pattern. Long the break out, anticipated price action and target is shown on the chart, stop daily close below 134$.
Hit the like button please if you find this useful :)
This is only my own view and not a financial advice,

See all ideas
Summarizing what the indicators are suggesting.
Neutral
SellBuy
Strong sellStrong buy
Strong sellSellNeutralBuyStrong buy
Neutral
SellBuy
Strong sellStrong buy
Strong sellSellNeutralBuyStrong buy
Neutral
SellBuy
Strong sellStrong buy
Strong sellSellNeutralBuyStrong buy
An aggregate view of professional's ratings.
Neutral
SellBuy
Strong sellStrong buy
Strong sellSellNeutralBuyStrong buy
Neutral
SellBuy
Strong sellStrong buy
Strong sellSellNeutralBuyStrong buy
Neutral
SellBuy
Strong sellStrong buy
Strong sellSellNeutralBuyStrong buy
Displays a symbol's price movements over previous years to identify recurring trends.
Curated watchlists where NXST is featured.

Frequently Asked Questions
The current price of NXST is 184.60 USD — it has decreased by −1.34% in the past 24 hours. Watch Nexstar Media Group, Inc. stock price performance more closely on the chart.
Depending on the exchange, the stock ticker may vary. For instance, on NASDAQ exchange Nexstar Media Group, Inc. stocks are traded under the ticker NXST.
NXST stock has fallen by −2.79% compared to the previous week, the month change is a 3.68% rise, over the last year Nexstar Media Group, Inc. has showed a −0.76% decrease.
We've gathered analysts' opinions on Nexstar Media Group, Inc. future price: according to them, NXST price has a max estimate of 220.00 USD and a min estimate of 186.00 USD. Watch NXST chart and read a more detailed Nexstar Media Group, Inc. stock forecast: see what analysts think of Nexstar Media Group, Inc. and suggest that you do with its stocks.
NXST reached its all-time high on Feb 2, 2023 with the price of 217.76 USD, and its all-time low was 0.42 USD and was reached on Oct 27, 2008. View more price dynamics on NXST chart.
See other stocks reaching their highest and lowest prices.
See other stocks reaching their highest and lowest prices.
NXST stock is 3.75% volatile and has beta coefficient of 0.78. Track Nexstar Media Group, Inc. stock price on the chart and check out the list of the most volatile stocks — is Nexstar Media Group, Inc. there?
Today Nexstar Media Group, Inc. has the market capitalization of 5.57 B, it has decreased by −2.77% over the last week.
Yes, you can track Nexstar Media Group, Inc. financials in yearly and quarterly reports right on TradingView.
Nexstar Media Group, Inc. is going to release the next earnings report on Aug 7, 2025. Keep track of upcoming events with our Earnings Calendar.
NXST earnings for the last quarter are 3.37 USD per share, whereas the estimation was 3.10 USD resulting in a 8.86% surprise. The estimated earnings for the next quarter are 2.71 USD per share. See more details about Nexstar Media Group, Inc. earnings.
Nexstar Media Group, Inc. revenue for the last quarter amounts to 1.23 B USD, despite the estimated figure of 1.23 B USD. In the next quarter, revenue is expected to reach 1.21 B USD.
NXST net income for the last quarter is 104.00 M USD, while the quarter before that showed 241.00 M USD of net income which accounts for −56.85% change. Track more Nexstar Media Group, Inc. financial stats to get the full picture.
Yes, NXST dividends are paid quarterly. The last dividend per share was 1.86 USD. As of today, Dividend Yield (TTM)% is 3.85%. Tracking Nexstar Media Group, Inc. dividends might help you take more informed decisions.
Nexstar Media Group, Inc. dividend yield was 4.28% in 2024, and payout ratio reached 31.58%. The year before the numbers were 3.44% and 55.93% correspondingly. See high-dividend stocks and find more opportunities for your portfolio.
As of Aug 2, 2025, the company has 13.01 K employees. See our rating of the largest employees — is Nexstar Media Group, Inc. on this list?
EBITDA measures a company's operating performance, its growth signifies an improvement in the efficiency of a company. Nexstar Media Group, Inc. EBITDA is 2.06 B USD, and current EBITDA margin is 38.80%. See more stats in Nexstar Media Group, Inc. financial statements.
Like other stocks, NXST shares are traded on stock exchanges, e.g. Nasdaq, Nyse, Euronext, and the easiest way to buy them is through an online stock broker. To do this, you need to open an account and follow a broker's procedures, then start trading. You can trade Nexstar Media Group, Inc. stock right from TradingView charts — choose your broker and connect to your account.
Investing in stocks requires a comprehensive research: you should carefully study all the available data, e.g. company's financials, related news, and its technical analysis. So Nexstar Media Group, Inc. technincal analysis shows the neutral today, and its 1 week rating is buy. Since market conditions are prone to changes, it's worth looking a bit further into the future — according to the 1 month rating Nexstar Media Group, Inc. stock shows the buy signal. See more of Nexstar Media Group, Inc. technicals for a more comprehensive analysis.
If you're still not sure, try looking for inspiration in our curated watchlists.
If you're still not sure, try looking for inspiration in our curated watchlists.