ORMP Possible SupportHere is the monthly chart of ORMP. They came out with bad news on their leading drug today. Looking at the chart the area that price stopped has been support historically. I bought in at 2.53 and will hold for a while. Exit around 4 seems to be a good trade based on previous data.
Not financial adv
Next report date
—
Report period
—
EPS estimate
—
Revenue estimate
—
−0.70 USD
−19.06 M USD
0.00 USD
32.55 M
About Oramed Pharmaceuticals Inc.
Sector
Industry
CEO
Nadav Kidron
Website
Headquarters
New York
Founded
2002
FIGI
BBG000LRYR36
Oramed Pharmaceuticals, Inc. engages in the provision of oral delivery solutions for drugs delivered via injection. It concentrates on the research and development of pharmaceutical solutions, including an oral insulin capsule to be used for the treatment of individuals with diabetes, and the use of orally ingestible capsules or pills for delivery of other polypeptides. The company was founded by Nadav Kidron and Miriam Kidron on April 12, 2002 and is headquartered in New York, NY.
Related stocks

TASE:ORMP Oramed Pharm - is a clinical stage biopharmaceutical company.
It looks dead after before the Ru war on the UA, right after corona crysis.

Preparing to conduct clinical trials for an ORAL Covid vaccineThis could be interesting. I am sure there are numerous companies racing to see if they can get an oral version of a Covid vaccine out into the market and especially booster tablets.
Oramed focuses on making oral delivery solutions for drugs typically delivered via injection. Its current focuses
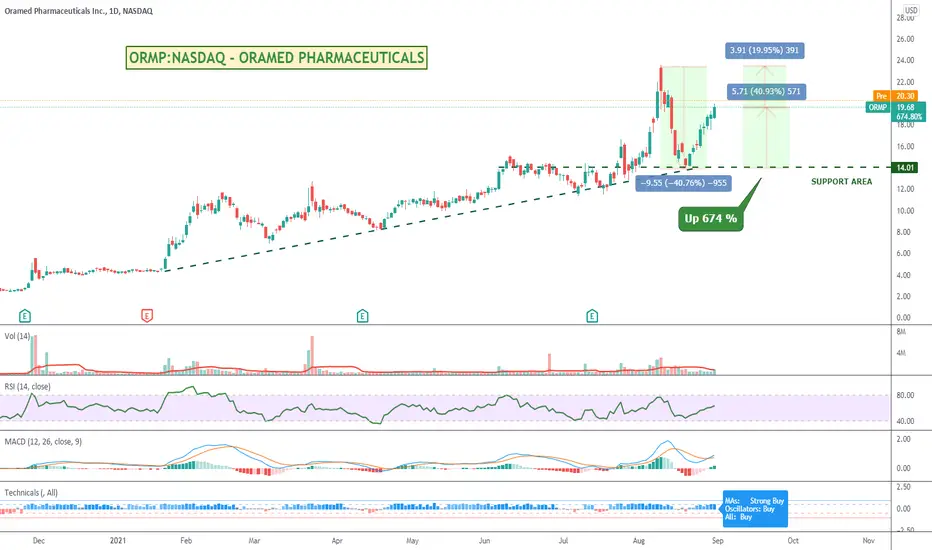
ORMP (ORAMED PHARMACEUTICALS Inc.) - False BreakMarket structure: Uptrend, price might retest previous resistance turn support
Setup: False Break/ Retest previous resistance turn support
False Break candlestick pattern: Hammer / Bullish engulfing
To look for trading opportunities when price retest previous resistance turn support at around 14.40

TASE:ORMPHI-TECH - BIOMED - BIOTECHNOLOGY
DEVELOPING TECHNOLOGY TRANSFORMING INJECTABLE INTO ORAL THERAPIES.

ORMP by request KeyCode 2 Possible PathsI made a key code of the price action then found an exact match to this move in the past.... one that matched at lease 95% or better. That way if the move is that close to the same shape we have now it must mean the sentiment of the market was the same at that time. Therefore, the outcome should be


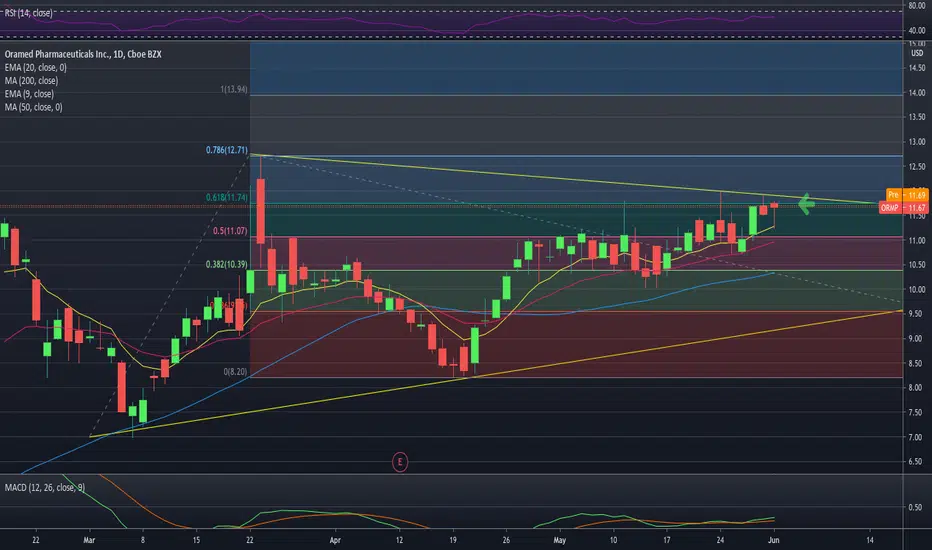
ORMP BullishI like the recent MACD cross and yesterday's candle testing the 9 ema only to close higher making a hammer candle. 11.74 appears to be resistance so I will be looking for a break of 11.74 for a long swing entry.
Target: 12.71 in the short term.
ORMP High Tight FlagHigh tight flag chart pattern forms when a stock rises over 90% (preferably 100%) or more in two months, then consolidates sideways for 15-25 days with a decline of no more than 25%. When there's a breakout of the sideways 'flag' on high volume , the powerful uptrend often resumes.
The entry point

the world's first Phase 3 oral insulin studyOramed Doses Patients Across Multiple Sites in Phase 3 Oral Insulin Study
Randomization of patients in the world's first Phase 3 oral insulin study conducted under FDA approved protocol
Announced today that randomization of patients in its first Phase 3 study of its oral insulin capsule ORMD-0801

See all ideas
Summarizing what the indicators are suggesting.
Oscillators
Neutral
SellBuy
Strong sellStrong buy
Strong sellSellNeutralBuyStrong buy
Oscillators
Neutral
SellBuy
Strong sellStrong buy
Strong sellSellNeutralBuyStrong buy
Summary
Neutral
SellBuy
Strong sellStrong buy
Strong sellSellNeutralBuyStrong buy
Summary
Neutral
SellBuy
Strong sellStrong buy
Strong sellSellNeutralBuyStrong buy
Summary
Neutral
SellBuy
Strong sellStrong buy
Strong sellSellNeutralBuyStrong buy
Moving Averages
Neutral
SellBuy
Strong sellStrong buy
Strong sellSellNeutralBuyStrong buy
Moving Averages
Neutral
SellBuy
Strong sellStrong buy
Strong sellSellNeutralBuyStrong buy
Displays a symbol's price movements over previous years to identify recurring trends.
Frequently Asked Questions
The current price of ORMP is 2.12 USD — it has decreased by −1.40% in the past 24 hours. Watch Oramed Pharmaceuticals Inc. stock price performance more closely on the chart.
Depending on the exchange, the stock ticker may vary. For instance, on NASDAQ exchange Oramed Pharmaceuticals Inc. stocks are traded under the ticker ORMP.
ORMP stock has fallen by −5.36% compared to the previous week, the last month showed zero change in price, over the last year Oramed Pharmaceuticals Inc. has showed a −13.82% decrease.
We've gathered analysts' opinions on Oramed Pharmaceuticals Inc. future price: according to them, ORMP price has a max estimate of 3.25 USD and a min estimate of 3.25 USD. Watch ORMP chart and read a more detailed Oramed Pharmaceuticals Inc. stock forecast: see what analysts think of Oramed Pharmaceuticals Inc. and suggest that you do with its stocks.
ORMP reached its all-time high on Jan 13, 2014 with the price of 31.73 USD, and its all-time low was 0.09 USD and was reached on Apr 2, 2004. View more price dynamics on ORMP chart.
See other stocks reaching their highest and lowest prices.
See other stocks reaching their highest and lowest prices.
ORMP stock is 4.81% volatile and has beta coefficient of 0.42. Track Oramed Pharmaceuticals Inc. stock price on the chart and check out the list of the most volatile stocks — is Oramed Pharmaceuticals Inc. there?
Today Oramed Pharmaceuticals Inc. has the market capitalization of 86.59 M, it has decreased by −0.46% over the last week.
Yes, you can track Oramed Pharmaceuticals Inc. financials in yearly and quarterly reports right on TradingView.
Oramed Pharmaceuticals Inc. is going to release the next earnings report on Aug 13, 2025. Keep track of upcoming events with our Earnings Calendar.
ORMP earnings for the last quarter are −0.19 USD per share, whereas the estimation was −0.01 USD resulting in a −1.80 K% surprise. The estimated earnings for the next quarter are −0.04 USD per share. See more details about Oramed Pharmaceuticals Inc. earnings.
Oramed Pharmaceuticals Inc. revenue for the last quarter amounts to 2.00 M USD, matching the estimated figure, and no changes in revenue are expected for the next quarter.
ORMP net income for the last quarter is −7.64 M USD, while the quarter before that showed −10.19 M USD of net income which accounts for 25.00% change. Track more Oramed Pharmaceuticals Inc. financial stats to get the full picture.
No, ORMP doesn't pay any dividends to its shareholders. But don't worry, we've prepared a list of high-dividend stocks for you.
As of Aug 3, 2025, the company has 13 employees. See our rating of the largest employees — is Oramed Pharmaceuticals Inc. on this list?
Like other stocks, ORMP shares are traded on stock exchanges, e.g. Nasdaq, Nyse, Euronext, and the easiest way to buy them is through an online stock broker. To do this, you need to open an account and follow a broker's procedures, then start trading. You can trade Oramed Pharmaceuticals Inc. stock right from TradingView charts — choose your broker and connect to your account.
Investing in stocks requires a comprehensive research: you should carefully study all the available data, e.g. company's financials, related news, and its technical analysis. So Oramed Pharmaceuticals Inc. technincal analysis shows the strong sell today, and its 1 week rating is strong sell. Since market conditions are prone to changes, it's worth looking a bit further into the future — according to the 1 month rating Oramed Pharmaceuticals Inc. stock shows the sell signal. See more of Oramed Pharmaceuticals Inc. technicals for a more comprehensive analysis.
If you're still not sure, try looking for inspiration in our curated watchlists.
If you're still not sure, try looking for inspiration in our curated watchlists.