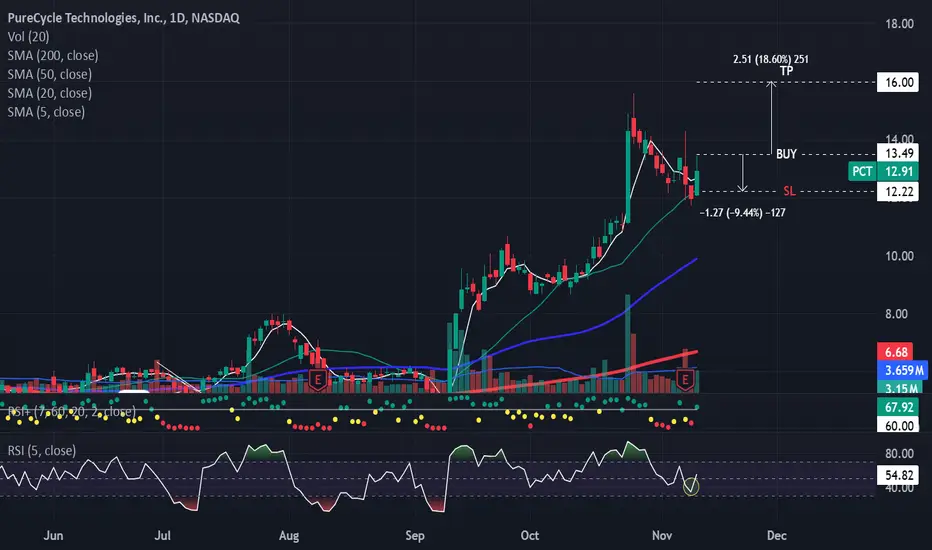
New Setup: PCTPCT: I have a green setup signal(dot Indictor). I'm looking to enter long near the close of the day if the stock can manage to CLOSE above the last candle highs(white line). If triggered, I will then place a stop-loss below(SL) and a price target above it(TP1-50%,move SL to breakeven). Using the 10SMA as a trailing stop loss.
********
Note: The above setups will remain valid until the stock CLOSES BELOW my set stop-loss level.
PCT trade ideas
Long PCT @5.475 before the close todayThis one can be a real roller coaster. My first trade in the last 12 months is still being held and down 48% and I have 7 open lots that are all down at least 28%. However, I have also closed 3 trades in PCT in that time that gained between 48% and 51% and 5 total closed trades over 40% in the last 12 months. In all, 26 of the 33 trades so far were profitable.
INCLUDING the 7 currently held losers, the average return of all 33 trades in the last 12 months is +5.1% and the median trade is also at 5.1%.
It is resting right above its 50d SMA and has rejected significant breaks through the 50d twice in the last two days, closing above it both times. It also had 5 consecutive down days before today and today it rallied to close flat with yesterday or it would have been 6. All of those are good news IMO.
It had a 10 consecutive down day streak to open the year, but then rallied over 100% in the next 2 months. At the end of that it tanked 12% in one day, only to have reclaimed all of that and then some over the next 11 trading days. Then it lost 30+% in a month and then gained almost 50% in the next 2 months. So like I said, make sure the safety harness is in the locked position and have the oxygen mask ready as it could be a very wild ride.
A 5% rally from here (the average trade result) just gets it back to its 5d SMA so it feels like this one COULD be a >5% rebound to overbought. Will sell all lots that are profitable once it becomes overbought.
Full disclosure, a recent news release about focusing on upgrades to their systems is, IMO, telegraphing a weak earnings report, and I suspect why the stock is oversold.
TBH this one doesn't feel as much like a lock as my previous trades did, but the potential significant upside on this makes it attractive. It could be a nothing burger or even a loss, given that the stock itself is down 50% or so in 12 months. But it has been trending upward for the last few months, so I'm willing to take a shot here.

PCT Short ReviewAnother position I took that I wasn't feeling comfortable enough to publish at the time -- this time on $PCT.
Idea introduced to me by John Hempton on Twitter, have followed the stock for months waiting for the right time to short, and happened to pick the exact week for the meatiest short. Definitely got very lucky, exited at 6.12 last week.
Will be keeping a look out for a swing opportunity at some point and will be sure to post it the next time -- very volatile stock for a company desperately trying to raise money to aid production.

PCT LongPureCycle Technologies, Inc. (PCT) produces recycled polypropylene (PP). PureCycle plans on developing a polypropylene recycling facility in Belgium and the company believes the facility has the potential for a total annual capacity of 500 million pounds. PureCycle is currently engaged in feedstock sourcing and financial planning with the intent to secure a final project timeline by mid-2023. Construction of the plant is expected to begin upon completion of the permitting process, which is currently anticipated in 2024. Source: www.prnewswire.com
On 2/9/23, someone bought the PCT 5/19 11C 17,000x 1.07. To me, I believe they must be thinking 12.50-14.00 on a risk-reward basis, which is a a 75% move from where its trading at currently…they are either betting on incredibly good earnings or a upcoming catalyst/announcement.

PureCycle Tech (Is it bottoming?)View On PureCycle PCT(9 Jan 2023)
I am seeing some bounce aka (rebound play) in this US stock,
Now $5~$6 region can be a good cushion and it can go UP higher.
If things work out well, $8.50 shall be pretty reachable.
Let review it again in an month time or so.
DYODD, all the best and read the disclaimer too.
Feel Free to "Follow", press "LIKE" "Comment".
Thank You!
Legal Risk Disclosure:
Trading foreign exchange or CFD on margin carries a high level of risk, and may not be suitable for all investors.
The high degree of leverage can work against you as well as for you. Before deciding to trade foreign exchange you should carefully consider your investment objectives, level of experience and risk appetite.
The possibility exists that you could sustain a loss of some or all of your initial investment and therefore you should not invest money that you cannot afford to lose.
You should be aware of all the risks associated with foreign exchange trading, and seek advice from an independent financial advisor.
DISCLAIMER:
Any opinions, news, research, analyses, prices or other information discussed in this presentation or linked to from this presentation are provided as general market commentary and do not constitute investment advice.
Sonicr Mastery Team does not accept liability for any loss or damage, including without limitation to, any loss of profit, which may arise directly or indirectly from use of or reliance on such information.

PCT Swing Idea$PCT missed earnings and took a fall but, I see a MACD crossover forming, a low RSI, and volume sentiment coming back to this stock. I see analyst have it ranked at the highest of $30. So a nice long trade here should be profitable.

$spy $pct About to take off? 22% short interestAbove 15 and you have to be long. 22% short very high

PCT is the FUTUREAs you look at the basic indicators accompanied with ability to close the loop on plastic, we have a winner!

PCT stockBeen riding this wave. A bit over extended but support at 15.38 and 15.87. It’s slowly climbing daily with an excellent rounded bottom. I’m expecting a retest of original pattern breakdown up in the 20s. I’d buy a pull back. I’m long since 14$

PCT SMA Short Term ChartThis chart shows that over the course of the last two weeks, the hourly chart has simple moving average lines that have crossed each other. Specifically, the 50 day SMA and the 100 day SMA are below the 200 day SMA line showing that the stock is trading downwards compared to historical data. It does seem that the 50 day SMA has taken an upturn and is looking to come back above the 100 and 200 day SMAs in the short term.

PCT VWAP ChartThis hourly chart showing the price action over the last month shows that PCT has recently dipped under the volume weighted average price line and is now trading around the line but slightly under. In the short term, the VWAP could serve as a line of resistance, but in the past the VWAP shows no signs of being either a line of support nor resistance.

PCT SMA/RSI ChartSince PCT's IPO it has been trading in a general uptrend, this chart shows that PCT has had a bounce off of it's 200 day simple moving average line showing support. PCT is trading around the 50 day simple moving average line now looking to show a support line there as well. The relative strength index for PCT is moderate as of now showing it is neither overbought nor oversold currently.
