Multi Short Signal Triggered On PDDThis is a short swing trade technical chart setup that looks like a pull back to potentially $65.
Note: This is not financial advice. If you like this idea and want more, follow me.
PDD trade ideas

$PDD with a Bullish outlook following its earnings #Stocks The PEAD projected a Bullish outlook for $PDD after a Positive Under reaction following its earnings release placing the stock in drift A with an expected accuracy of 60%.

V BottomEL is a break of the V on the other side similar to a Cup and Handle Breakout.
The V bottom is not rounded at the bottom like a cup is though.
Short interest is around 4.45%.
Gap under price.
No recommendation.
Don't be a hero (o:
Spinning tops. Possible pull back.

$PDD worth watching for swing puts or callsMy earlier bullish outlook on this stock has now become more neutral. The dashed yellow line connects closing prices while the solid yellow line connects lows.
Based on RSI and stochastic right now, price could move either way, but the 20sma is crossing down below 200 and RSI is under 50. For the time being I lean bearish and watching 30/60m timeframe for a trade entry. Watch price to see what it does between the two yellow lines.

PDD reverts to 70 fair price; Inv H&S targets 119.PDD after bottoming after a H&S at the top, createa another inverse H&S & HAS SINCE REACHED THE COMMON NECKLINE AROUND 70, which I think is the market”s FAIR PRICE.
Let us wait which direction this will lead to but I AM BIASED LONG. TP is 119 for H&S pattern measured move.
Not trading advice

#PDD inverted head & shouldersCan this #chinese listed stock climb?
#pdd displaying an inverted head & shoulders
Neckline 72.00
Overhead Objective 120

$PDD Excellent Volume Pattern$PDD not in a confirmed stage 2 uptrend.
But looks as good as it can get.
Volume pattern is excellent.

$PDD looks promising for more upsideFrom Dec. you can see a bottoming formation on the daily chart, and price is back above the yellow line now. 20sma is sloped upward while price has taken a breather and brought RSI down to retest 50. RSI closed below 50 on 21Sep. If today it is back at/over 50 after market close, then today's candle is a signal for another leg up. In order for this RSI 50-test to trigger calls, the stock has to trade over today's high on Friday, 23Sep.
There is an unfilled gap ~54.70, moving back down to the 200sma. I would exit swing calls if the stock does not move higher in the next day or two because this trade idea is based on a continuation move higher.

US Stock In Play: $PDD$PDD - Consumer Cyclical | Internet Retail | China
not a fan of trading china companies but the setup with its high ADR% and RS looks ripped for a BO to 52-weeks high

ICT Approach To Stocks. PDD Ticker ✨Hey Guys, Yurii Domaranskyi here. Risk vs Reward = 1 to 9.94✨ It means if you risk here 100$ you may make 994$ Not bad, huh?

$PDD with a Bullish outlook following its earnings #Stocks The PEAD projected a Bullish outlook for $PDD after a Positive Under reaction following its earnings release placing the stock in drift A with an expected accuracy of 50%.

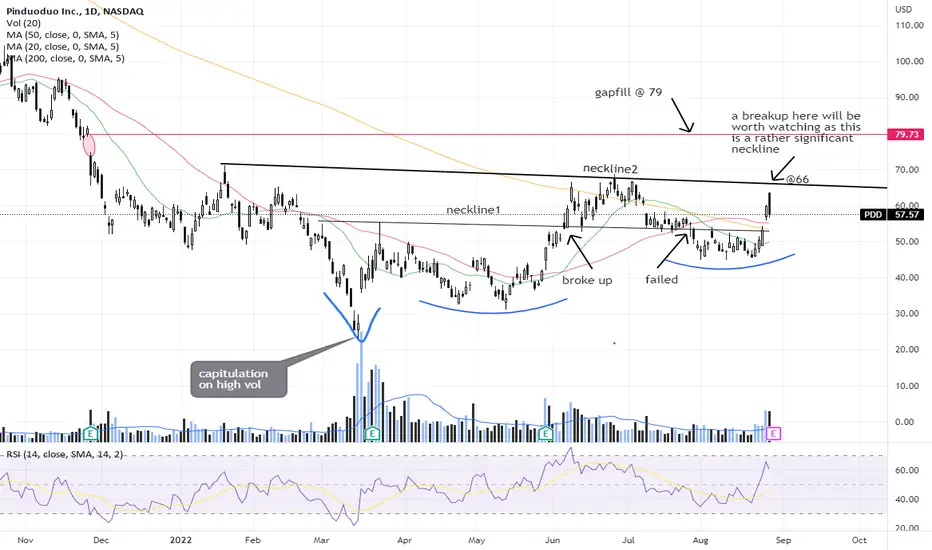
PDD - will it breakup soon?PDD had an earlier breakup of an Adam & Eve formation (@ neckline1) that subsequently failed. It is now approaching a more significant neckline (neckline2) and the earnings that is expected out soon could give a clue if the worst over and if the stock is on the way to propel higher, especially if it could continue to hold above the 200 day Moving Average. Let's see!
Disclaimer: Just my 2 cents and not a trade advice. Kindly do your own due diligence and trade according to your own risk tolerance and don't forget that money management is important! Take care and Good Luck!
ABC BullishEarnings 8-29 BMO.
Channel up.
Possible stop below C or where you see support.
Long entry is a clear break above the BC trendline.
No recommendation.
EPS (FWD)
1.98
PE (FWD)
26.92
Short Interest
2.96%
Market Cap
$67.28B
Announce Date
08/29/2022 (Pre-Market)
EPS Normalized Estimate
$0.42/Last quarter .44/beat
EPS GAAP Estimate
$0.31/Last quarter .27/beat
Revenue Estimate
$3.45B/last quarter 3.55 Billion/beat
EPS Revisions (Last 90 Days)*
up-4 down-2

PDD ShortBounce back to supply Zone, Zone Confirmation
Trendline break
Earning: 8/25/2022 Est. 0.42
Short 62.5
Stop 73
Target 50, 35
Risk management is much more important than a good entry point.
I am not a PRO trader.
In my trading plan, the Max Risk of each short term trade should be less than 1% of an account.


$PDD Short term Trade OutlookAm extremely selective in picking stocks and $PDD can be a potential mover. $88 is next target. If the stock rollovers to $47, I will be out.

PDD - Completed H&S Pattern PDD has completed a large H&S pattern on this daily timeframe
0.382 has now became an area of support, previously being seen as a point of resistance

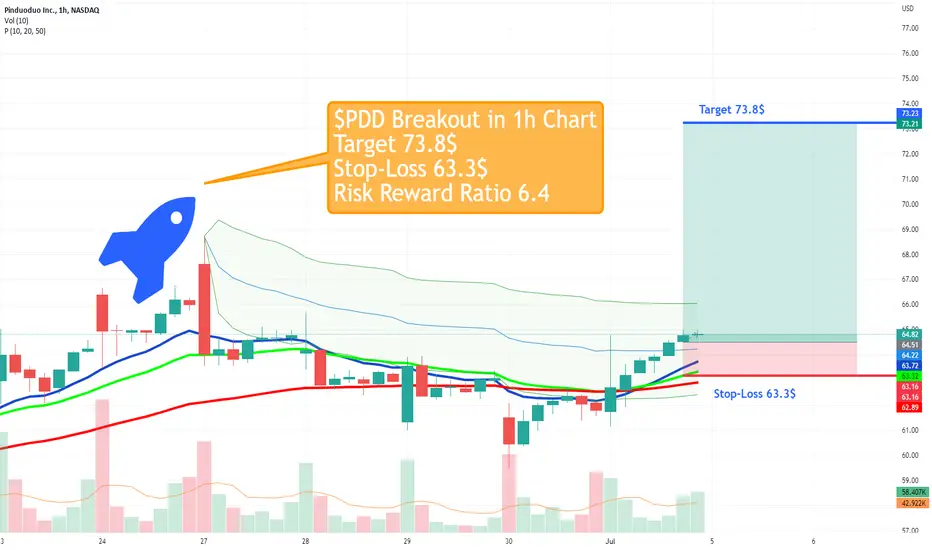
$PDD Breakout #Stocks #Fintwit$PDD Breakout 🚀 in 1h Chart and reclaim of vwap on above average volume - Target 73.8$ 🧲
All Entry Criteria have been met:
1. Price above 10, 20 & 50 EMA ✅
2. Consolidation Phase in Uptrend ✅
3. Breakout on above average Volume✅

#PDD $PDD lovely break from 14 month downtrend 🥶Shorts are getting burned on the china plays, and we love to see that ! ;)
watching for break past 70-71 for continuation.. after that we can target 96.69-133.43-170.17

6/26/22 PDDPinduoduo Inc. ( NASDAQ:PDD )
Sector: Retail Trade (Internet Retail)
Market Capitalization: $82.667B
Current Price: $65.96
Breakout price: $71.40
Buy Zone (Top/Bottom Range): $55.15-$31.65
Price Target: $94.60-$98.60 (1st), $115.40-$119.30 (2nd)
Estimated Duration to Target: 60-66d (1st), 120-129d (2nd)
Contract of Interest: $PDD 8/19/22 80c, $PDD 10/21/22 90c
Trade price as of publish date: $3.85/contract, $4.50/contract

Long China Short USUnpopular, unpatriotic title, but the chart doesn’t lie. China tech overall has been basing and looking to break out of the long term downtrend while US tech has struggled. PDD has higher beta than its Chinese peers and I am looking to hedge with shorting the de-facto US e-commerce play, Amazon. Although it would be a more apples to apples comparison to pick a more niche US e-commerce stock, like an Etsy or EBay, shorting one of those would provide more volatility and increase risk. Relative performance between PDD and AMZN is making a textbook cup and handle formation. PDD itself is also making a cup and handle formation, tightening around the level 65, a level of previous resistance and support. AMZN has an unfilled gap in the 130s and previous high around 125 as heavy short term levels of resistance. Long PDD, short AMZN.

WATCH $PDDBullish
Fundamental
- Funds accumulating
- Good earning
- Positive P/FCF
- Positive PEG
- Positive PE
- Undervalued
TA
- Price out of woods
- Broke away from downtrend line
- Price above POC = everyone who bought at that level are making money
- Price resting at major S/R
- Momentum out of the woods turning positive
* falling wedge = momentum of price free fall decreases over time
