$PDD with a Bullish outlook following its earnings #Stocks The PEAD projected a Bullish outlook for $PDD after a Positive under reaction following its earnings release placing the stock in drift A with an expected accuracy of 100%.
If you would like to see the Drift for another stock please message us. Also click on the Like Button if this was useful and follow us or join us.
PDD trade ideas

PDD awaiting 143.75 to break out This is one China tech stock that I am looking at.
Once it breaks out of 143.75 resistance, I would be adding more to this stock !
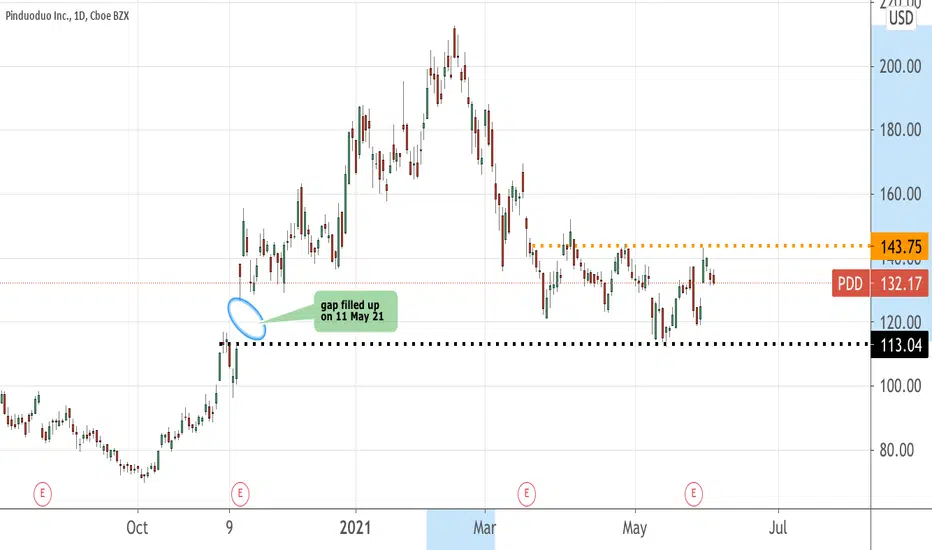
PDD gap fillAt this point the only thing you can short is earnings or Chinese ADRs, lol.
China trying to kill ADRs, I think PDD fills the gap within 2 weeks
more overdone nothing burgersPressing this thing back into its hole. Could run a bit more, but looks ready to retrace. More puts.

Pull Back Fishing Earnings Tomorrow BMOFormer Parabolic Arc with earnings tomorrow before market opens.
Arcs fall between 50 to 79% as a rule with the average falling between 62 and 79%. It is possible to fall more than 79% and also possible to fall less than 50%.
PDD has fallen more than 62% and less than 79% so price is in the average fall zone. Price can remain volatile for some time.
Price was below the lower band set on 80 briefly before snapping back inside.
89% would fall at 49.60.
No recommendation.
Counting on Mr. Market to do the same thing twice, can leave you disappointed.

PDD 21.8.13A great buy here. Probably go to 93 in two days.
A great buy here. Probably go to 93 in two days.
A great buy here. Probably go to 93 in two days.

Perfect 9 $PDDLegging in every Demark signals from $BABA $PDD and $JD
ARK Invest had a big sell in $PDD and $JD yesterday. They wanted to reduce exposure to the uncertainties ahead. I myself will keep adding at this area using 0.1% of capital per trade.

PINDUODUO Inc. (PDD) | Chinese E-commerce Inside a Buying Area!Hi,
Pinduoduo Inc., through its subsidiaries, operates an e-commerce platform in the People's Republic of China. It operates Pinduoduo, a mobile platform that offers a range of products, including apparel, shoes, bags, mother and childcare products, food and beverage, fresh produce, electronic appliances, furniture and household goods, cosmetics and other personal care items, sports and fitness items, and auto accessories. The company was formerly known as Walnut Street Group Holding Limited and changed its name to Pinduoduo Inc. in July 2018. Pinduoduo Inc. was incorporated in 2015 and is headquartered in Shanghai, the People's Republic of China.
Technically speaking, the price of PDD has landed inside the possible rejection area. Quite strong criteria matching each other around $81 to $106:
1. Fibo 62%
2. Minor trendline
3. 50% from the ATH
4. Role reversal
5. Round number
Do your own fundamental research and if it looks attractive then you have the technical confirmation from my side to buy it!
Regards,
Vaido

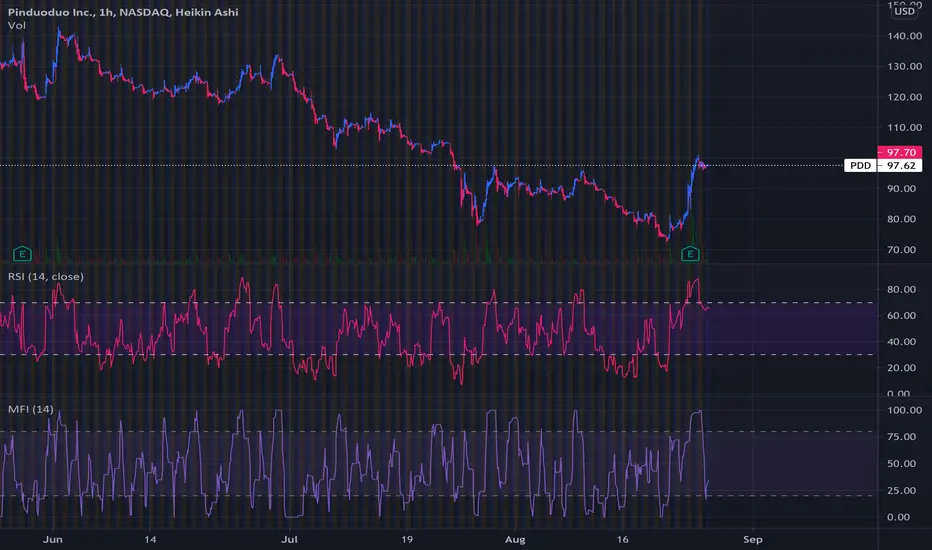
Falling WedgeWill be keeping an eye on PDD in the upcoming weeks as its forming a massive falling wedge (bullish) and also is nearing the oversold range on the RSI.
- Just some support and resistance levels to keep an eye on as well as some RSI based supply and demand zones
- Looking for a breakout from this wedge (Broader market conditions permitting)

PDD Gap-up above $113 supply shelf next week will then see $118 (Opinion Only)
Open gap above at $118 + a bullish reversal weekly candle. If EEM and PDD gap up next week where PDD is above $113 this will likely run to $118 to fill that gap above.
A lot of bullish unusual options activity in this name today.

$PDD long idea$PDD breaking out this mid range at the golden pocket area. I like entry here for a swing aiming for the .236 fib level as main target. Hopefully we get the move before earnings!

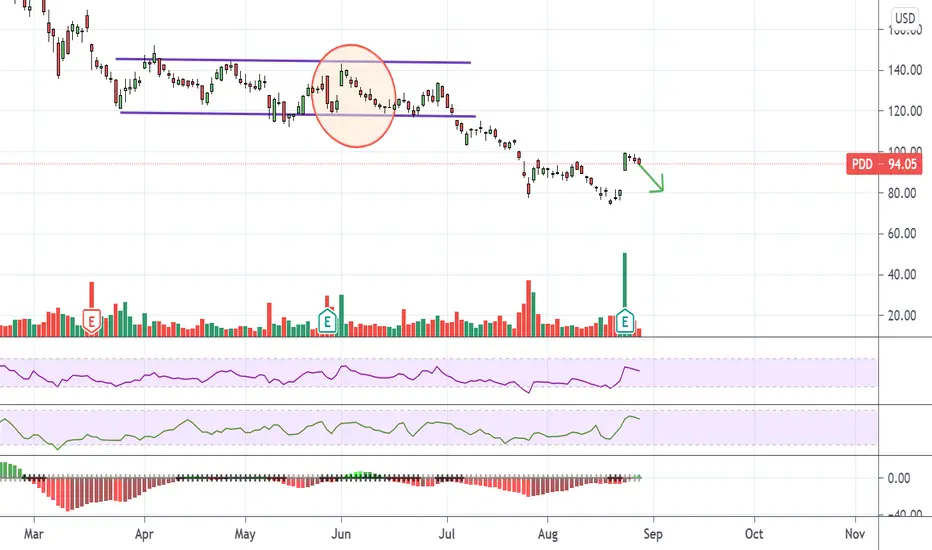
PDD rangebound LongMessy rangebound trading, but this global market positive feedback loop will probably push HSI even further overbought. Maybe wait until MFI goes oversold, target 135.


PDD UpdateLooks to me like it;s doing range bound trading, wait until $140 to short. Should be overbought by then
Watch the Chinese market if you're gonna play this in eitehr direction


ABC BullishABC Bullish is in hopes that C is C. C on this one does line up with the fib level but sometimes C fails. Possible stop under C or if more conservative, possibly a stop somewhere under long entry level and cross your fingers.
Former parabolic arc so volatility is to be expected.
The One Black Crow candlestick pattern is made up of two candlesticks and starts with a long bullish white candle. It is followed by a long black candle which opens and closes lower than the previous white candle’s open and close. Remember, both candles in this pattern should be long candlesticks. A red candle has the open at the top of the candle body and the close of the period at the bottom of the candle body. A green candle is vice versa. The high of the day is at the end of the top wick and the low of the day is at the bottom of the bottom shadow for both green and red candles.
A Marubozu candle can be either red or green, bullish or bearish with very little or no shadows on either end so it is shaven. It shows the bears were in charge the whole session.
The Belthold is a bullish candle and performs fairly well in the scheme of candles and candle patterns. They occur at or close to a bottom and should be a green candle with no lower shadow which closes near the high, meaning little or no upper shadow.
No recommendation


undervalued $PDDI value $PDD at 343 billion with extremely conservative declining revenue growth rates (<25%) and a consistent 45% FCF margin in the next 20 years.
These Demark's 13s are great buys.
$PDD and $BABA are the best undervalued plays at the moment.

$PDD Pinduoduo Support Zone Must Hold
Hopefully you find the chart helpful in terms of Supports & Resistance etc.
we refrain from adding commentary on the chart as that is reserved for our members and we are very conscious of not giving financial or trading advice.
Thank you for taking time to consult our chart and we would really appreciate a like, follow or comment.
